Walmart Stock cools into earnings as options price a 4.1% move

Walmart Stock remains in an established daily uptrend, though momentum has cooled as the market digests gains ahead of next week’s earnings. A near-term base sits near 130, while 133 caps the topside. Therefore, WMT shares look biased to range rather than run into the event.
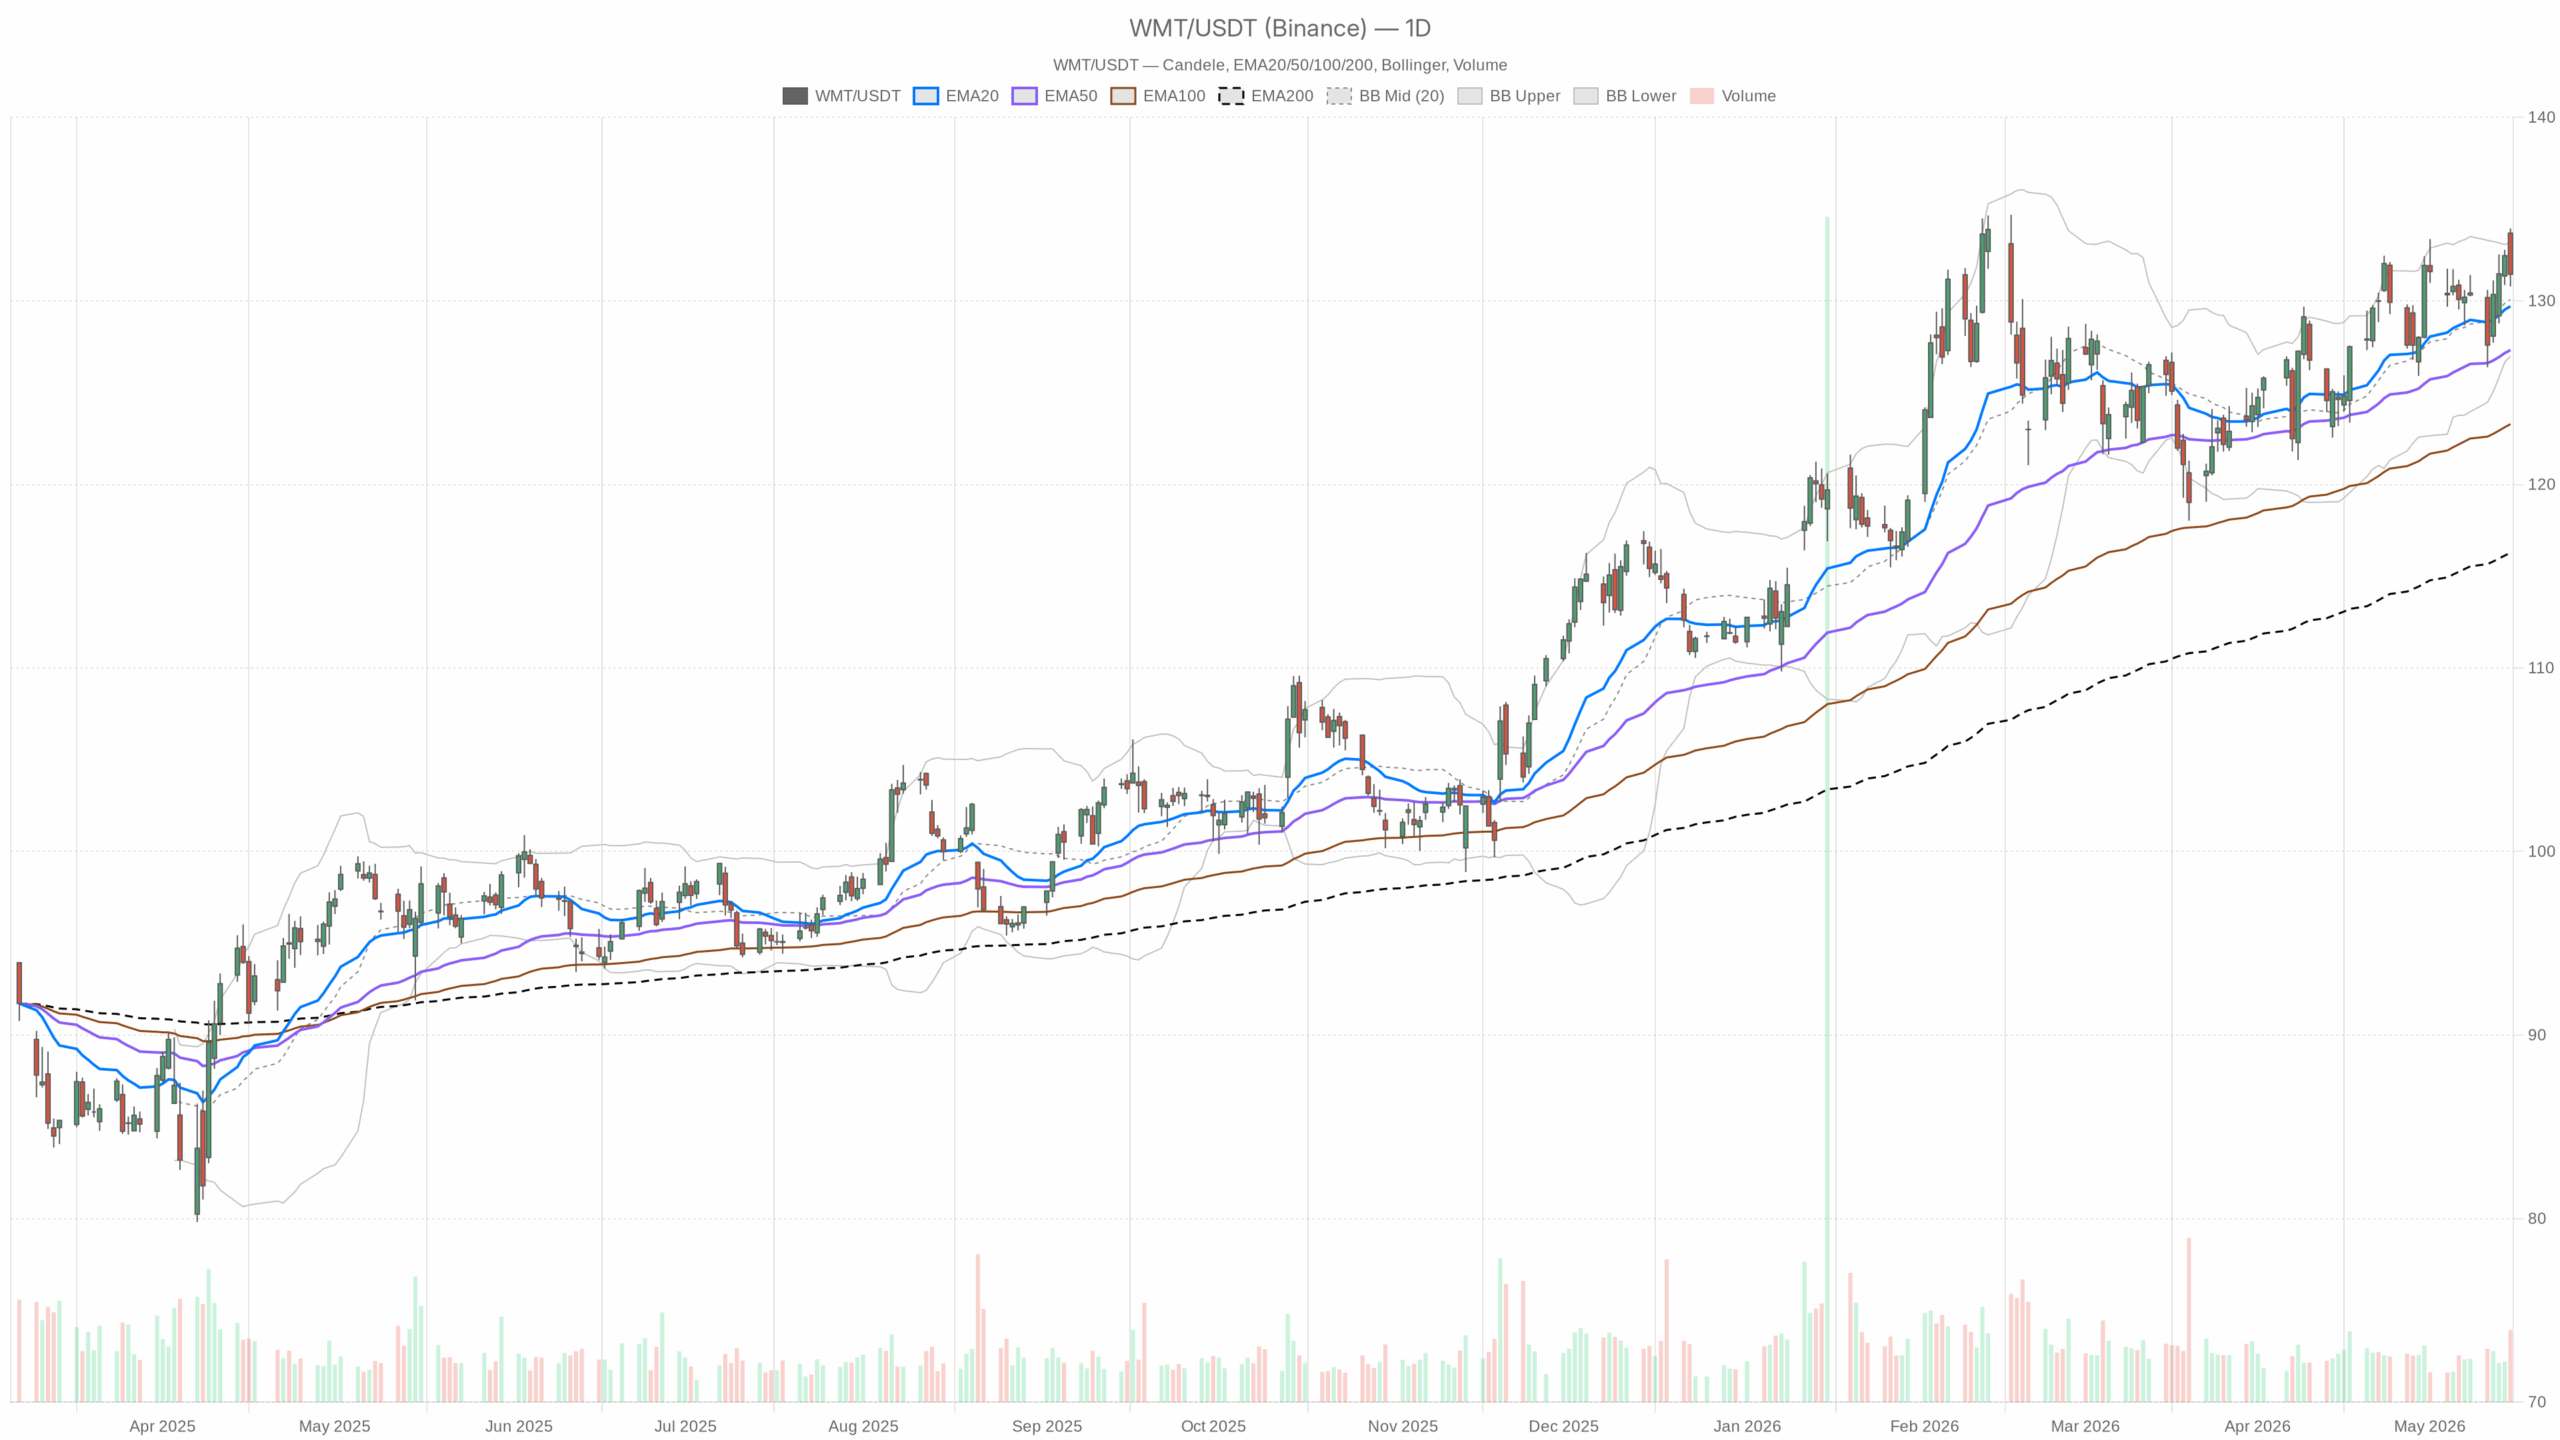 WMT — daily chart with candlesticks, EMA20/EMA50 and volume.
Daily Chart: Walmart Stock Uptrend, Momentum Cools
Trend and Moving Averages
Price closed at 131.45, above the 20-day EMA at 129.71 and the 50-day at 127.32. The 200-day sits at 116.28. This bullish EMA stack confirms an established uptrend. RSI(14) prints 56.8, showing constructive momentum without overbought risk.
Momentum and Volatility
MACD is marginally positive with a 0.02 histogram, signaling upside momentum that is flattening. Bollinger Bands center on 130.07, with the upper at 133.15 and lower at 126.98. Notably, Friday’s high briefly pierced the upper band before closing back inside, a common digestion signal.
ATR(14) is 2.63, pointing to moderate daily volatility and room for earnings-day expansion. The daily pivot sits at 132.06, with R1 at 133.34 and S1 at 130.18. Therefore, the 130–133 zone remains the decisive battleground.
However, there are early signs of stalling rather than reversal. Friday’s close slipped below the daily pivot at 132.06 while holding above the Bollinger mid and 20-day EMA. Buyers still control the trend, but they’re no longer pressing.
Intraday: 1-Hour Trend Backs the Range
On the 1-hour timeframe, price hovers at 131.51, just above the 20-EMA at 131.37 and well above the 50-EMA at 130.79 and 200-EMA at 128.95. Meanwhile, the intraday trend remains up.
RSI(14) is 53.9, a mild positive tone. MACD histogram is -0.14, showing cooled short-term momentum. Bollinger mid is 131.58 with bands at 132.84/130.32, placing price near the mid and signaling balance. ATR(14) is 0.80. Overall, the hourly pivot at 131.37 with R1 at 131.67 and S1 at 131.20 shows the tape orbiting fair value while it waits for a catalyst.
15-Minute: Neutral, Timing Tool
On the 15-minute chart, price sits at 131.51 with the 20-EMA at 131.43, 50-EMA at 131.52, and 200-EMA at 130.90. These short-term averages are flat, reflecting balance. RSI(14) is 50.3. MACD shows a small positive histogram at 0.04 while the lines sit slightly negative. Therefore, the tight ATR(14) at 0.30 favors fades over chase entries near extremes.
Event Risk Into Walmart Earnings
Notably, UBS reiterated a Buy rating ahead of Walmart earnings, while options pricing implies a roughly 4.1% move on May 21. Realized volatility can jump around the print. At the same time, headlines on corporate restructuring and a bearish valuation take from Seeking Alpha inject mixed sentiment, which can cap follow-through until numbers arrive.
Scenarios for Walmart Stock
Bullish Setup
A sustained reclaim of the daily pivot at 132.06 would open 133.15 (daily Bollinger upper) and 133.34 (R1). Clearing this shelf would put Friday’s 133.95 high back in play.
- Confirmation would include hourly MACD turning back above signal and RSI pushing toward 60.
- Rising Bollinger bandwidth on the hourly would add confidence, with volatility expanding alongside price.
What Weakens the Bullish Case
The bullish case weakens if WMT repeatedly fails near 132 and slips below 131.20 (hourly S1). A decisive daily close under 130.18 (S1) would shift focus to the Bollinger mid-to-lower band zone near 130.07/126.98, marking a transition from digestion to drawdown.
- Deterioration signals would be daily RSI losing 50 and MACD turning negative.
- Expanding ATR while price trends lower would underscore control by sellers.
Bottom Line for Walmart Stock
Overall, positioning into Walmart earnings favors a light, tactical stance. The trend is still up, yet the tape is pausing with implied volatility set to rise. Respect the 130–133 range, watch the 132 handle for control, and let earnings decide whether Walmart Stock extends the uptrend or resets lower.


Ayrıca Şunları da Beğenebilirsiniz

Alpha Ladder Group and MetaComp Partner with Maqam International Holding, an Abu Dhabi (UAE) company, to Advance RWA Tokenisation and Web2.5 Payments Across Singapore-UAE Corridor

Goldman Sachs crypto ETF holdings drop XRP and Solana in Q1 2026 filing