

Hive stock stalls at the 200-day EMA as momentum fades

Hive stock watchers saw a stall just below its 200-day EMA into Friday’s close, keeping the daily bias neutral. The HIVE stock price ended at 2.69, a whisker under 2.70, as short-term momentum softened.
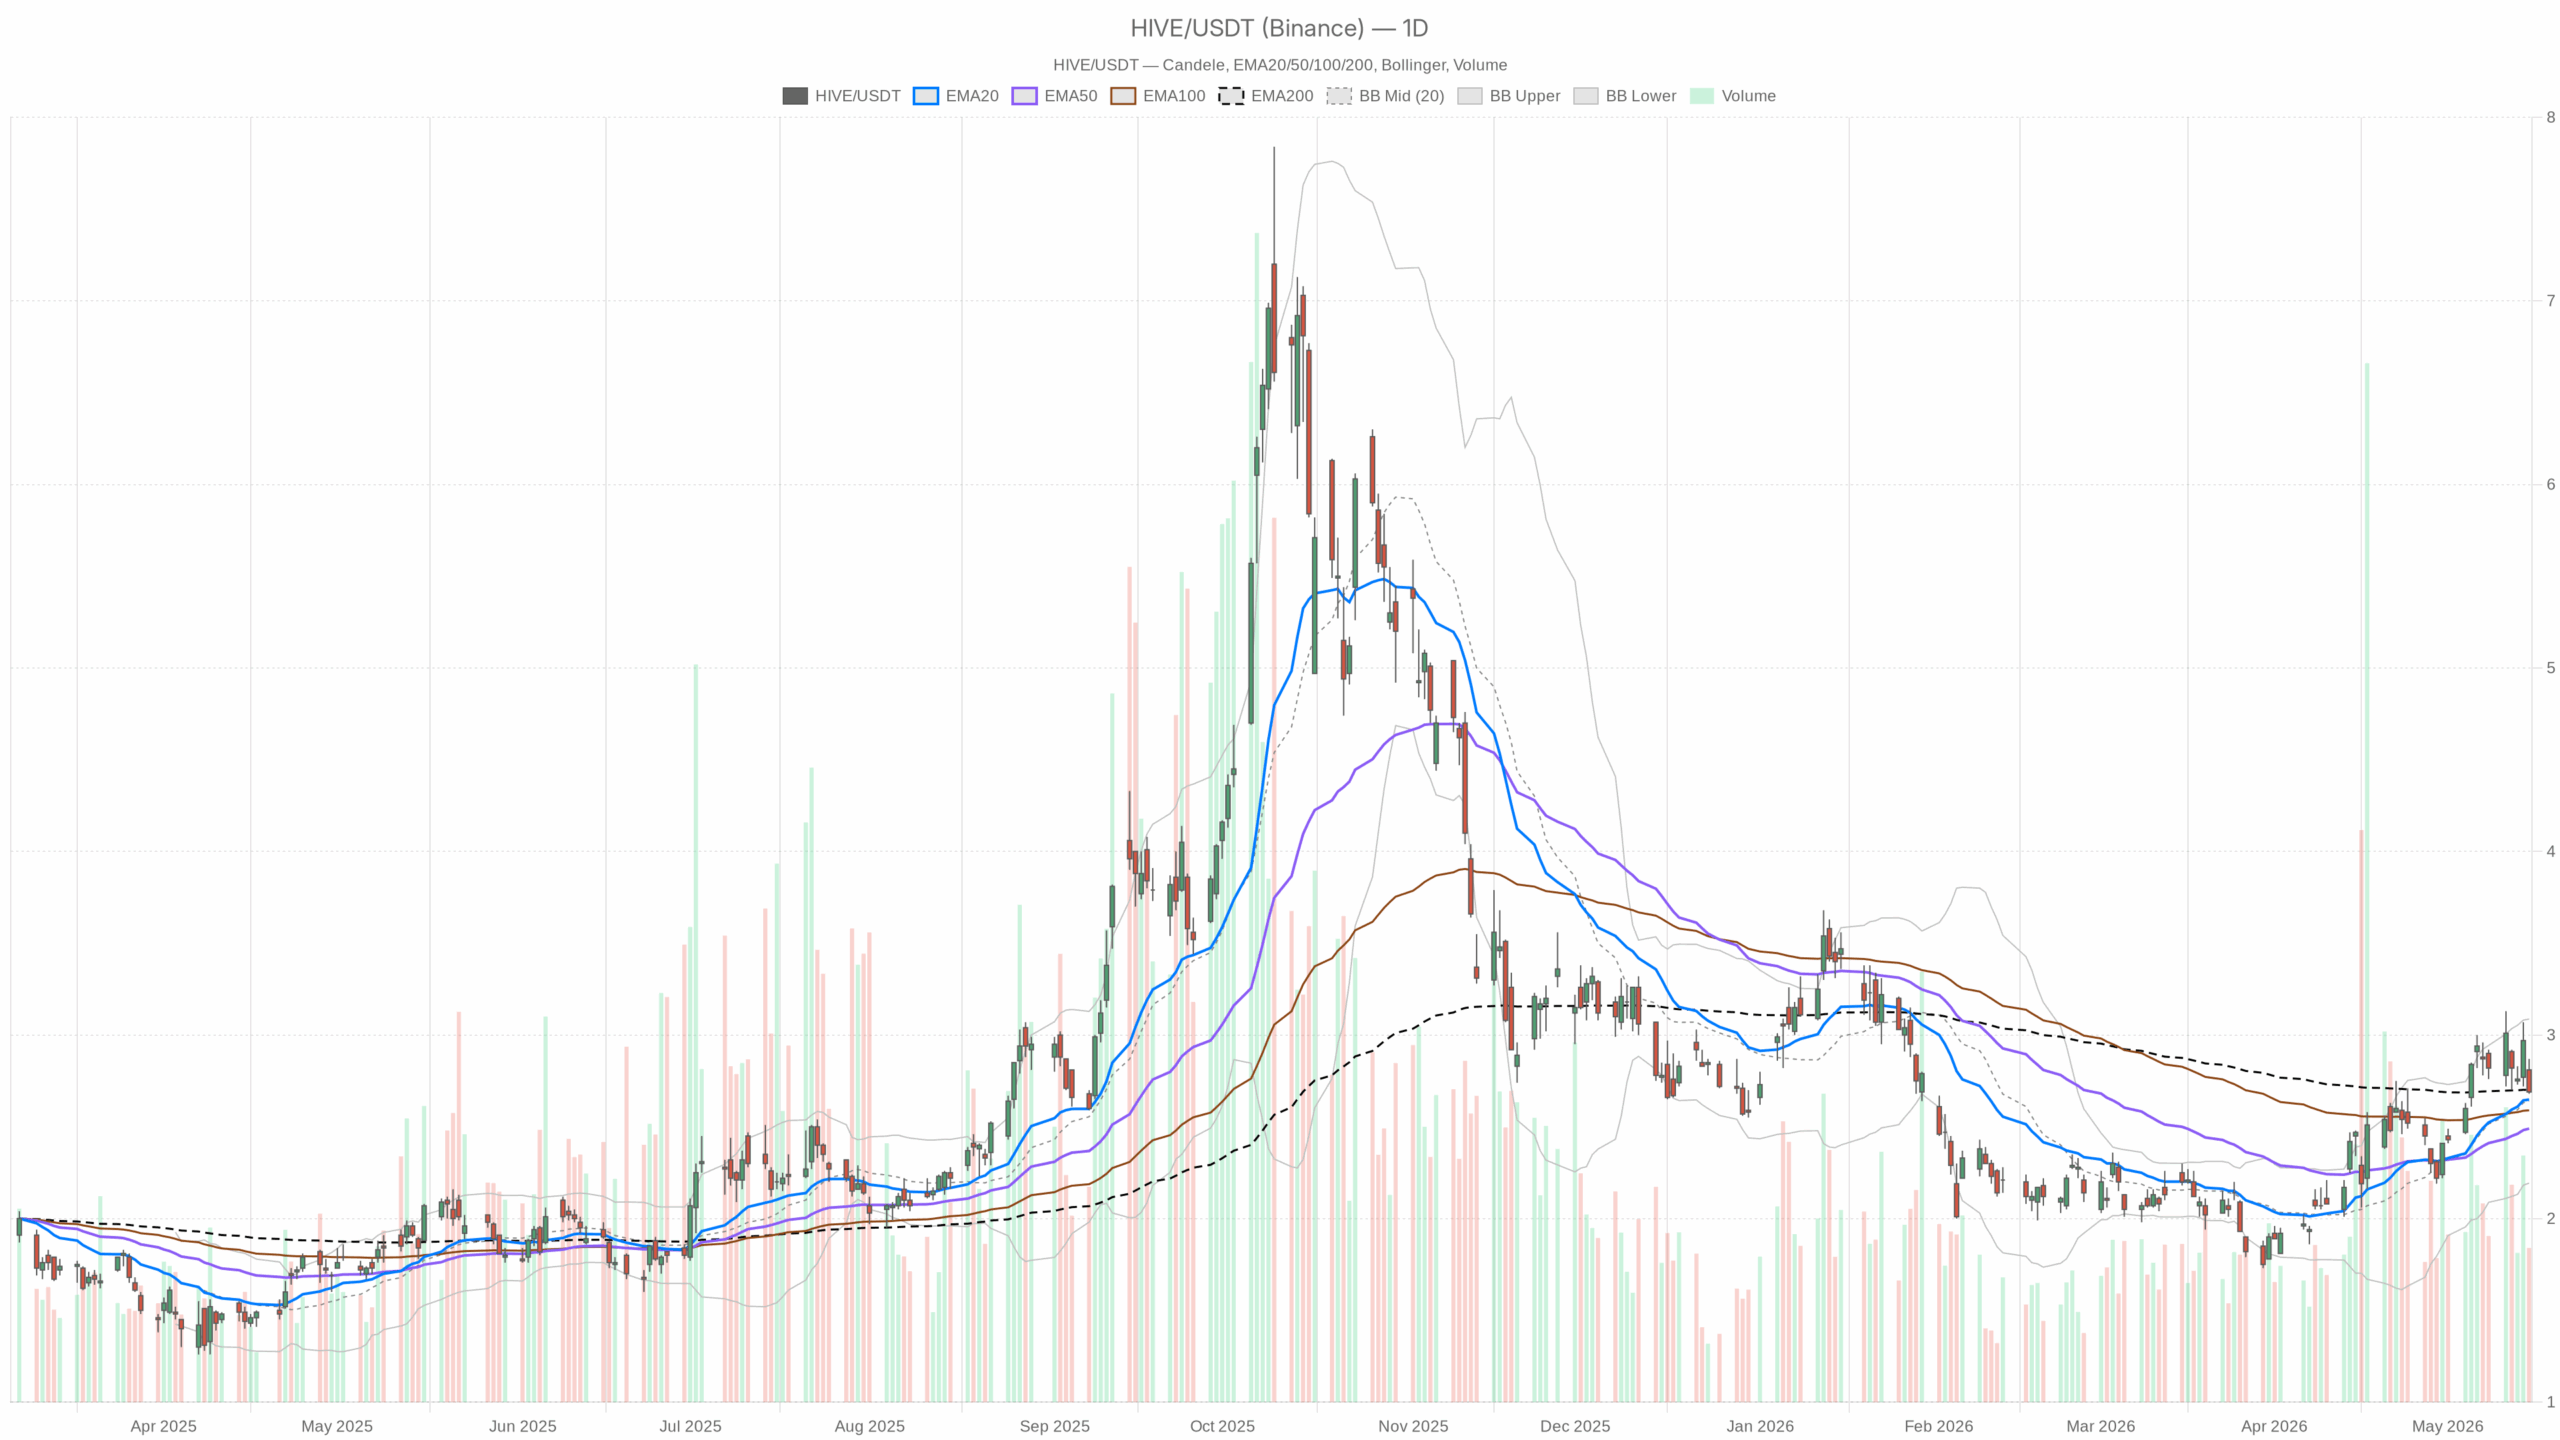 HIVE — daily chart with candlesticks, EMA20/EMA50 and volume.
Hive stock: HIVE daily setup at the 200-day
Trend and momentum
On the daily chart, price at 2.69 sits above the EMA20 2.65 and the EMA50 2.49, preserving a rising near-term structure. It is fractionally below the EMA200 2.70, which tempers the trend signal. Meanwhile, RSI14 53.25 shows mild positive momentum. MACD 0.16 versus 0.15 with a flat histogram near zero indicates momentum has stalled.
Volatility and key levels
Bollinger Bands center at 2.64 with an upper at 3.09 and a lower at 2.19. Price is near the middle, so direction is undecided. Notably, ATR14 0.22 points to moderate daily volatility. The daily pivot at 2.75 with R1 2.81 and S1 2.62 sits just overhead from the close, keeping resistance nearby for HIVE shares.
Intraday pressure on HIVE: 1H momentum fades
Meanwhile, the 1H chart weakens the otherwise steady daily picture. Price near 2.70 sits below the 1H EMA20 and EMA50, both near 2.80, reflecting short-term pressure. It remains above the 1H EMA200 2.56, which still protects the broader hourly uptrend. RSI14 40.4 signals fading momentum, while MACD -0.03 versus -0.01 with a negative histogram shows bears hold the intraday initiative.
In addition, the Bollinger mid is 2.82 with a lower band at 2.61, leaving room to test lower levels. ATR14 0.09 indicates contained intraday ranges. The hourly pivot sits at 2.71 with R1 2.72 and S1 2.68; trading near the pivot implies chop unless momentum expands.
15-minute trend: bearish micro-structure
In contrast, the 15-minute context is outright bearish. Price around 2.70 sits below the EMA20 2.74, the EMA50 2.78, and the EMA200 2.79, aligning with a short-term down push. RSI14 36.9 shows sellers in control but nearing short-term oversold. MACD is flat near -0.03 versus -0.03 with a flat histogram, signaling a pause during consolidation.
The Bollinger mid at 2.72 with a lower band at 2.68 frames near-term support. Additionally, ATR14 0.02 signals tight micro ranges. The 15m pivot at 2.70 with R1 2.72 and S1 2.69 helps time entries around 2.69–2.72 for HIVE stock.
Bullish path: triggers and upside levels
Therefore, timeframes are mixed. The daily chart is neutral with a constructive tilt above the EMA20, while the 1H and 15m show soft momentum below short-term averages. That conflict argues for patience at range edges until signals align for “Hive stoco” participants.
Notably, a bullish break remains achievable. A daily close back above the EMA200 2.70 would be the first tell. A move through the daily pivot at 2.75 and into R1 2.81 would add confirmation. On the 1H, RSI pushing back above 50 and a positive MACD cross would signal momentum repair. From there, the upper daily Bollinger near 3.09 becomes a reasonable upside reference.
Bearish path: supports and risk markers
On the other hand, the bearish path opens if supports give way. A sustained slip below daily S1 2.62 would hand control to sellers and break the recent higher-timeframe base. Loss of the daily Bollinger mid at 2.64 would also matter, tilting the balance toward the lower band at 2.19 as a distant risk marker.
On the 1H, a roll toward the lower band at 2.61 with MACD deepening below zero would confirm pressure. That would invalidate the near-term bullish case until reclaimed. For “Hive stoco” traders, that sequence would shift focus to defense.
Market context and trading implications
Additionally, broader market weakness into Friday’s close provided a headwind. The major U.S. indexes slipped from records, which dampened risk appetite. For HIVE stock, that helps explain the soft intraday tape and the hesitation at long-term resistance.
Overall, HIVE sits at an inflection just under long-term trend resistance with moderate volatility. The 2.62–2.81 band defines the immediate field of play while timeframes disagree. Until higher- and lower-timeframe signals converge, positioning remains sensitivity-driven and volatility risk should be respected by Hive stock watchers.


Ayrıca Şunları da Beğenebilirsiniz

FCA and BoE Push Tokenised Securities Plan With July Feedback Deadline

Epstein survivors unload on Pam Bondi after Trump gives her he boot


