

ChatGPT Predicts Kaspa (KAS) Price if Bitcoin Crashes to $50k
Bitcoin price has continued to struggle after losing the important $80,000 support zone last week. The asset now trades close to $77,000, and that decline has reopened discussions about whether BTC could revisit lower levels later in 2026.
The latest drop matters because Bitcoin has already fallen roughly 30% from its 2026 high. Recent weakness has pushed the market back into the same broad range that dominated most of the year. The $60,000 to $79,000 zone has repeatedly acted as Bitcoin’s main battleground throughout 2026, and current price action shows that trend may still be active.
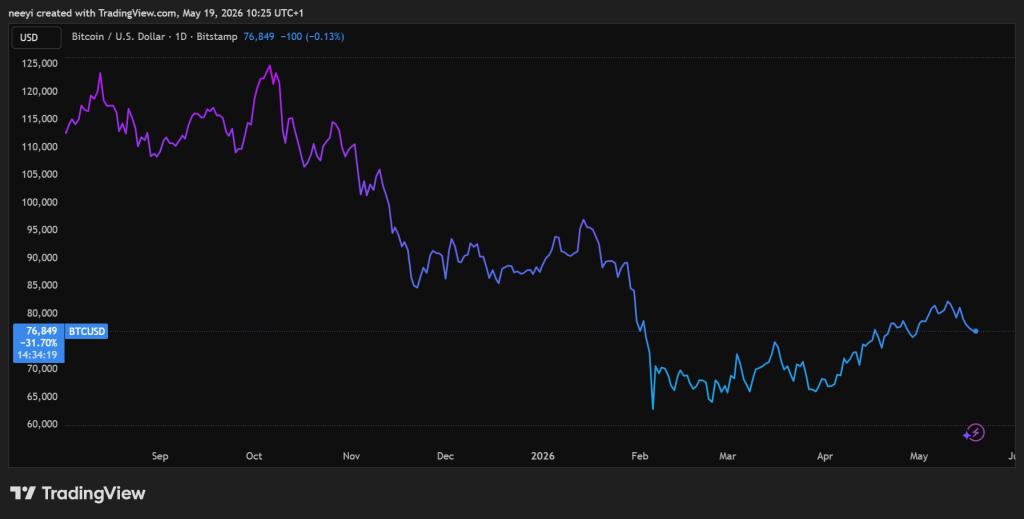 Bitcoin Price Chart / Source: TradingView.com
That possibility creates fresh pressure across the wider crypto market. Kaspa (KAS) now trades near $0.003, and the asset has already dropped about 35% from its January 2026 high.
Kaspa initially traded independently during its early growth phase. Current market structure looks very different now. KAS has become much more tied to Bitcoin’s broader macro direction, which means any major BTC decline could heavily influence Kaspa price action over the coming months.
Bitcoin Price Weakness in 2026 Continues Raising Broader Market Concerns
Several major macroeconomic factors continue pressuring Bitcoin in 2026. Liquidity conditions remain one of the biggest concerns.
Bitcoin performs best when excess capital flows into risk assets. Current market conditions have reduced that flow significantly. Central banks continue maintaining restrictive monetary policies because inflation remains stubborn in several major economies.
Higher interest rates create competition for crypto markets because investors can now access safer yield opportunities through bonds and money market instruments.
Quantitative tightening also continues reducing overall market liquidity. Central bank balance sheet reductions, defensive government spending patterns, and Treasury liquidity management have all reduced excess capital available for speculative markets like crypto.
Institutional positioning has also changed considerably during this cycle.
Bitcoin ETFs helped push BTC toward previous highs, though those same products now create downside pressure during periods of persistent outflows. Daily spot selling pressure becomes much more visible when ETF demand weakens.
Another factor deserves attention. Long term Bitcoin holders have continued distributing portions of their holdings after massive gains from previous cycles. Retail demand has struggled absorbing that supply consistently.
Regulatory developments have added more complexity to the market environment as well.
The Digital Asset Market Clarity Act has improved structural clarity in parts of the United States crypto market. Transition periods often create temporary uncertainty instead of immediate stability.
IRS transaction reporting rules have increased compliance pressure across exchanges and trading platforms. Europe’s MiCA enforcement framework has also moved from planning into active implementation. Several exchanges have adjusted listings and trading operations as a result.
Those combined pressures explain why Bitcoin continues struggling beneath previous highs despite strong institutional adoption narratives.
Kaspa Price Now Shows Much Stronger Correlation With Bitcoin
Kaspa’s relationship with Bitcoin has evolved dramatically over time.
KAS originally launched during the 2022 bear market when exchange access remained limited and community participation drove most activity organically. During that early phase, Kaspa price action showed weak correlation with Bitcoin because liquidity conditions around KAS remained isolated.
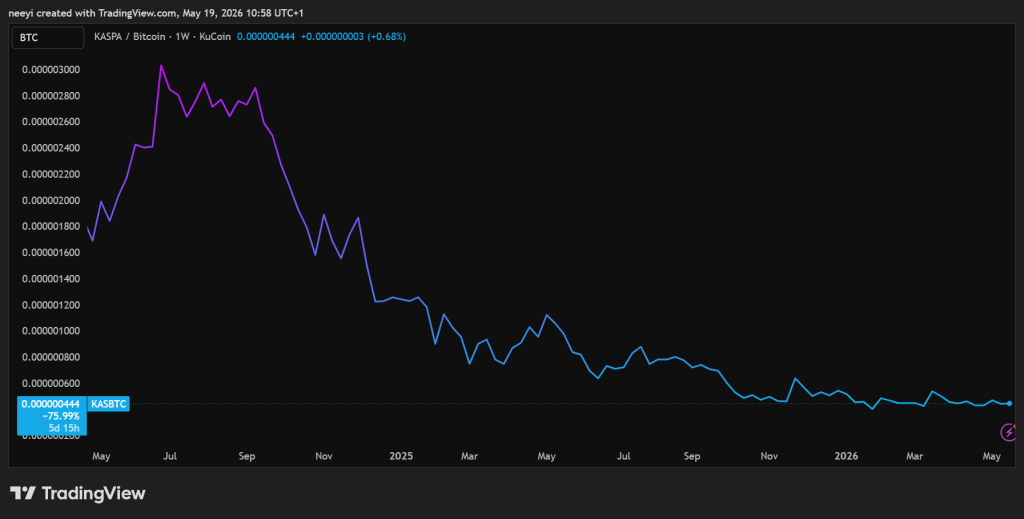 KASBTC Price Trend Since 2024 / TradingView.com
Things changed significantly between 2023 and mid 2024. Kaspa entered a strong price discovery phase during that period. Interest around the project’s GHOSTDAG technology pushed aggressive capital rotation into KAS. The asset dramatically outperformed Bitcoin during that stretch.
Kaspa now operates much more like a high beta Bitcoin extension. Correlation between BTC and KAS generally falls within the 0.6 to 0.8 range. Both assets share proof-of-work foundations and decentralized launch structures, which naturally connects broader investor behavior between them.
Kaspa also amplifies Bitcoin volatility.
During the earlier hyper-growth phase, a 5% Bitcoin rally could push KAS higher by 15% to 30%. Bitcoin declines during that period often produced smaller KAS pullbacks because exchange listings and retail demand absorbed selling pressure quickly.
The mature market phase has changed those dynamics considerably.
A 5% Bitcoin drop in today’s environment can easily push Kaspa lower by 12% to 18%. Heavy leverage inside perpetual futures markets now increases liquidation pressure during sharp downturns.
Bitcoin dominance trends create another challenge for KAS holders. Flat Bitcoin performance does not necessarily protect altcoins anymore. Capital frequently rotates back into BTC during uncertain periods even when Bitcoin itself trades sideways. That dynamic has contributed to continued weakness in the KAS/BTC trading pair throughout the past year.
ChatGPT Predicts Kaspa (KAS) Price If BTC Price Dips to $50k
We asked ChatGPT where Kaspa price could go if Bitcoin continues to dip to $50,000, and these are the possibilities:
Pessimistic Price Scenario
This scenario assumes Bitcoin loses the $60,000 region aggressively before falling toward $50,000 quickly. ETF outflows would likely intensify under those conditions. Liquidity would remain weak, and leveraged liquidations across altcoins could accelerate sharply.
Kaspa’s amplified downside beta could become extremely destructive in that environment. Since Bitcoin would decline roughly 35% from $77,000 toward $50,000, Kaspa could realistically suffer a 75% to 90% decline from current levels.
That scenario places KAS around $0.0003 to $0.00075
This outcome would likely resemble previous broad crypto capitulation phases where altcoins experienced extreme downside volatility.
Related Article: ChatGPT Predicts the XRP Price If Bitcoin Crashes to $50K
Realistic Price Scenario
This scenario assumes Bitcoin declines steadily instead of collapsing rapidly. Market conditions would remain weak, though panic selling would become more controlled over time. Bitcoin dominance would probably continue rising because investors often rotate capital back into BTC during uncertain conditions.
Kaspa would still likely underperform Bitcoin because of its current market structure. KAS could decline between 55% and 75% under this scenario.
That would place Kaspa’s price around $0.00075 to $0.00135
Current market behavior makes this scenario appear the most balanced if Bitcoin enters a prolonged downside cycle or extended consolidation phase.
Optimistic Price Scenario
This scenario assumes Bitcoin briefly touches $50,000 before recovering quickly afterward.
Improving liquidity conditions, stronger institutional demand, or renewed ETF inflows could support that type of recovery structure. Kaspa would still react negatively initially. Buyers could begin defending support levels sooner if confidence returns rapidly across the market.
KAS could decline between 35% and 55% in this scenario. That would place Kaspa around $0.00135 to $0.00195
This outcome would likely require Bitcoin’s drop toward $50,000 to feel temporary instead of the beginning of a deeper bear market cycle.
| Scenario | Bitcoin Market Structure | Estimated KAS Decline | Predicted KAS Price Range |
|---|---|---|---|
| Pessimistic | Sharp BTC capitulation and severe liquidity stress | 75% to 90% | $0.0003 to $0.00075 |
| Realistic | Gradual BTC decline and extended consolidation | 55% to 75% | $0.00075 to $0.00135 |
| Optimistic | Temporary BTC crash followed by quick recovery | 35% to 55% | $0.00135 to $0.00195 |
Kaspa’s relationship with Bitcoin has changed dramatically since its early growth years. KAS once traded independently during periods of aggressive adoption and exchange expansion. Current market conditions now show Kaspa behaving much more like a high beta version of Bitcoin itself.
That relationship means any move toward $50,000 for Bitcoin could produce amplified downside volatility for Kaspa price. Broader liquidity conditions, ETF flows, institutional positioning, and macroeconomic policy decisions may ultimately decide whether BTC stabilizes or moves lower during the second half of 2026.
FAQs
Subscribe to our YouTube channel for daily crypto updates, market insights, and expert analysis.
The post ChatGPT Predicts Kaspa (KAS) Price if Bitcoin Crashes to $50k appeared first on CaptainAltcoin.


Ayrıca Şunları da Beğenebilirsiniz

Ripple CTO explains XRPL hard forks before 3.1.3 deadline

ARP Digital Joins Fireblocks Network As GCC Settlement Partner In Regulated Payments Expansion


