

Bitcoin (BTC) Hits Critical Resistance at 200-Day MA — Can Bulls Regain Control?
Key Takeaways
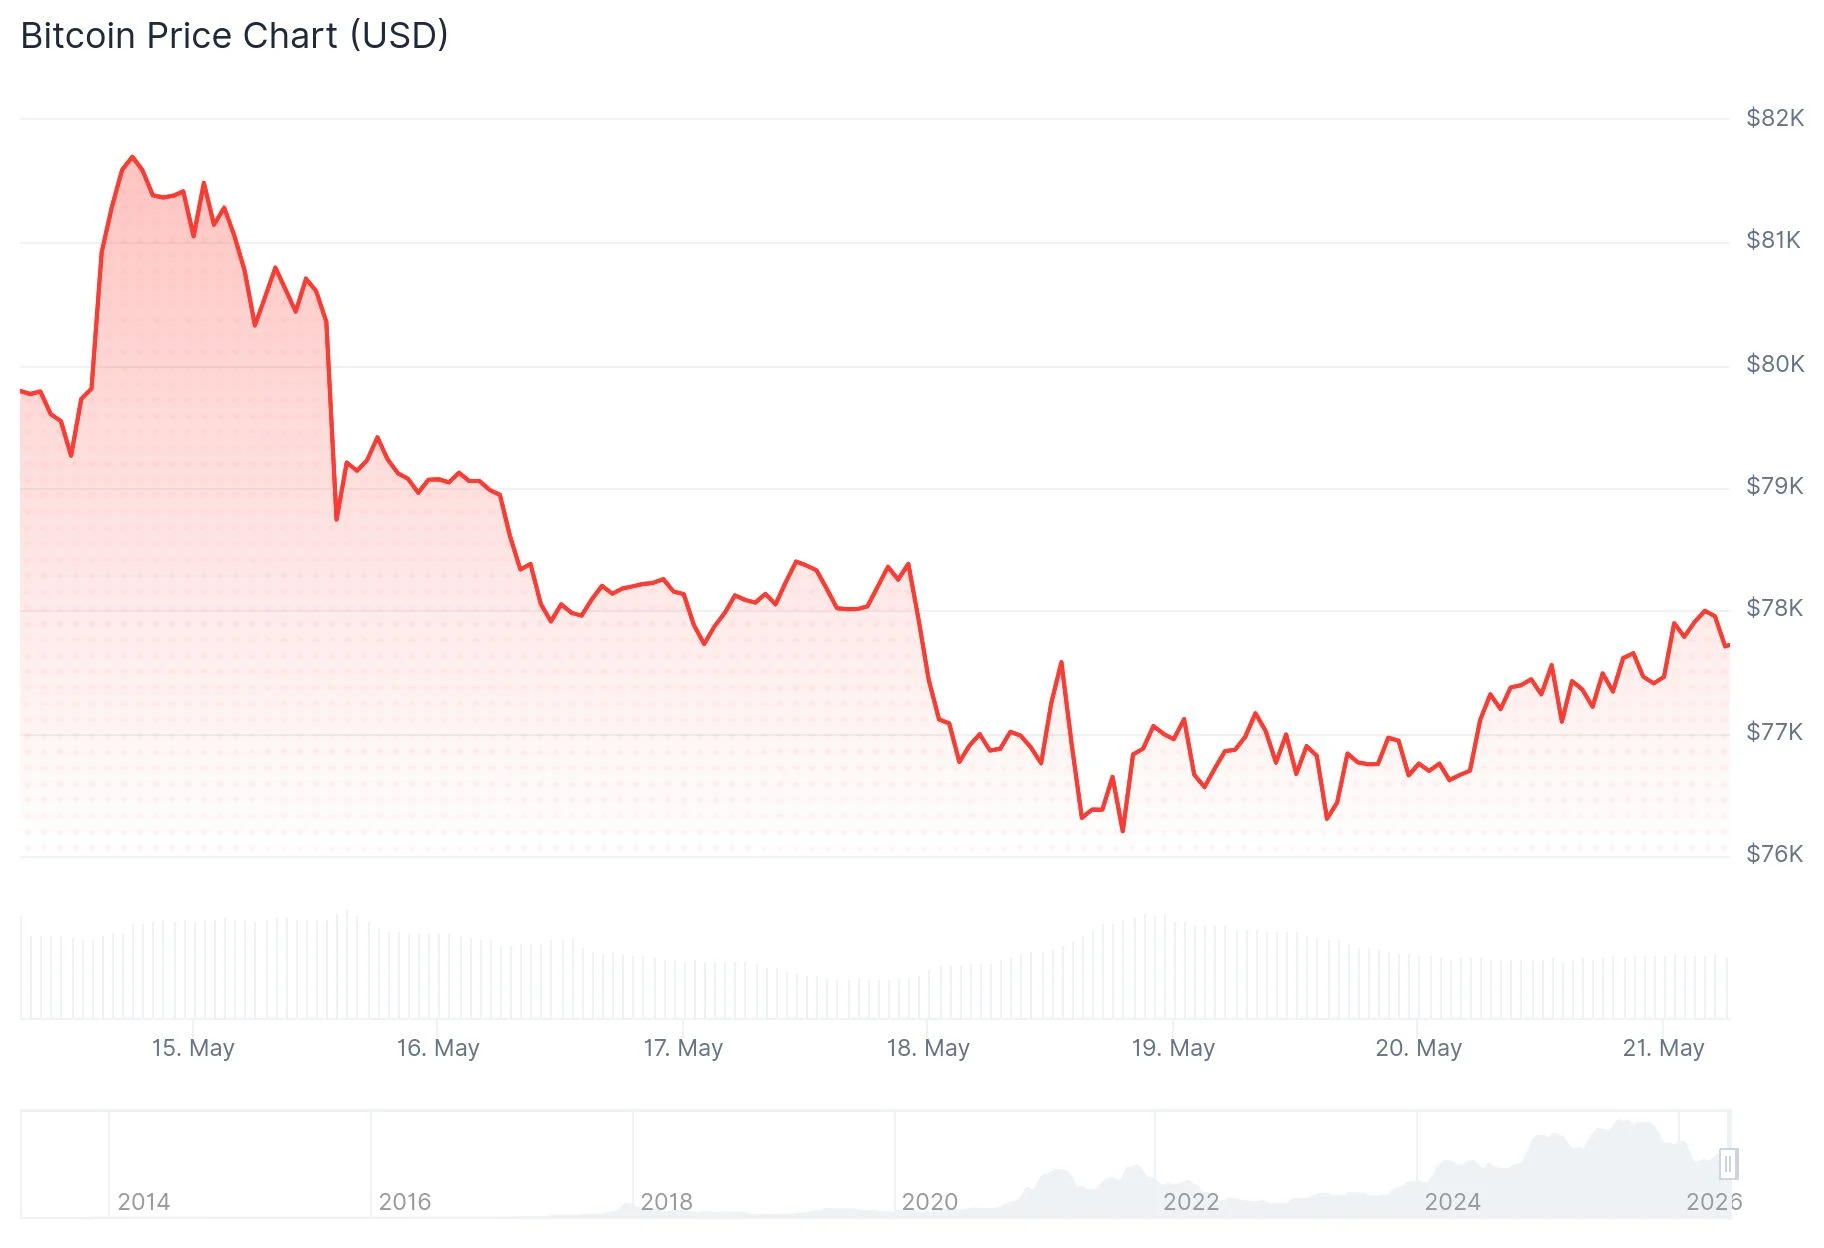
- Bitcoin encountered significant resistance at its 200-day moving average around $82,400, retreating to approximately $77,900.
- The Bull Score Index from CryptoQuant has plummeted to 20, indicating what the analytics firm categorizes as “extremely bearish” conditions.
- Approximately $2 billion has exited U.S. spot Bitcoin ETFs during the last two weeks.
- Buying interest from the United States, South Korea, and Hong Kong remains subdued.
- The critical on-chain support zone at $70,000 becomes the next significant target if downward momentum persists.
The recent Bitcoin recovery attempt from February’s depths has encountered significant headwinds. Following a climb approaching $82,000, the cryptocurrency met formidable resistance at the 200-day simple moving average (SMA), subsequently retreating to the $77,900 zone.
 Bitcoin (BTC) Price
Market participants pay particular attention to the 200-day SMA as a critical technical indicator. This moving average typically serves as a benchmark separating sustainable bullish reversals from temporary bear-market rallies. The inability to breach this threshold has sparked debate regarding the strength of the current upward movement.
Market analyst Ali Charts is monitoring the $77,800 threshold on shorter timeframes with particular interest. Based on Ali Charts’ analysis, Bitcoin has established a channel pattern on the 15-minute chart, with $77,800 serving as the upper boundary. A decisive break above this level could pave the way toward $79,000. Should this level continue acting as resistance, the analyst anticipates potential downside toward $76,900 or the broader $76,000 zone.
Declining Demand Emerges as Primary Concern
CryptoQuant, a leading blockchain analytics platform, identifies deteriorating demand as the central factor behind the stalled rally. The upward movement throughout April and early May was supported by three primary drivers: leveraged futures positions, spot market accumulation, and U.S. ETF capital inflows. Each of these catalysts has subsequently diminished.
The Bull Score Index tracked by CryptoQuant has declined sharply from 40 down to 20. This reading is characterized by the analytics provider as “extremely bearish,” comparable to conditions observed during the February-March timeframe when Bitcoin fluctuated within the $60,000 to $66,000 range.
The Coinbase Bitcoin premium — an indicator measuring whether BTC commands higher prices on Coinbase relative to international exchanges — has remained in negative territory throughout much of both the rally and the subsequent correction. Negative readings indicate that U.S.-based institutional and retail buyers are not aggressively pushing prices upward.
ETF Capital Flight and Subdued Asian Market Activity
U.S. spot Bitcoin exchange-traded funds have transitioned into a period of net selling. Data compiled by SoSoValue reveals the funds experienced approximately $979.7 million in withdrawals during the week concluding May 19, following nearly $1 billion in outflows the preceding week. This contrasts sharply with the six consecutive weeks of capital inflows that helped propel the earlier price advance.
The May 20 ETF flow statistics indicated Bitcoin ETFs recorded $70.5 million in net withdrawals while Ethereum ETFs experienced $28.1 million in outflows, suggesting demand has yet to fully stabilize.
South Korea’s kimchi premium, which gauges BTC demand on Korean cryptocurrency platforms, has fallen into negative territory. Meanwhile, Hong Kong’s trio of spot Bitcoin ETFs has registered negligible trading volumes throughout May, seldom exceeding several million dollars in combined daily activity.
Should downward price pressure intensify, CryptoQuant identifies $70,000 as the subsequent major on-chain support level. This price point previously capped rally attempts during both October and January and currently corresponds to the traders’ realized price according to on-chain metrics.
Bitcoin currently trades above $77,200 and the 100-hour simple moving average, facing immediate resistance at $78,300 followed by the $79,000 level.
The post Bitcoin (BTC) Hits Critical Resistance at 200-Day MA — Can Bulls Regain Control? appeared first on Blockonomi.


Ayrıca Şunları da Beğenebilirsiniz
Bitcoin (BTC) Dips Below $67K as Markets Enter Easter Break While Oil Hits 11% Single-Day Surge

Trump's revenge tour will come back to bite him in the you-know-what

Ethereum price today $2,130 — bearish below $2,150; $2,116 key


Popüler Haberler
Daha fazla
