

XRP Faces Final Flush Risk As $1.65 Resistance Blocks Recovery Move
XRP trades near $1.33 as $1.65 resistance caps recovery, while $1.10 and $0.87 remain key lower support levels.
XRP is trading near a key support area after another failed move below the wider consolidation range.
Traders are now watching the $1.65 resistance level, as a reclaim may be needed before any stronger recovery develops.
XRP Struggles Below $1.65 Resistance
XRP has continued to face selling pressure below the $1.65 resistance level. The asset has spent around four months trying to regain that area. However, buyers have not yet turned it into support.
The current setup shows a weak medium-term structure on the daily Bitstamp chart.
XRP was trading near $1.33 after falling from the $3.00 to $3.50 range. The price is now moving close to the lower part of the chart.
This position shows that buyers remain cautious. It also shows that the market has not formed a clear recovery base.
As long as XRP stays below $1.65, analysts may expect more pressure. A move above $1.65 would change the short-term view.
It would show that buyers are regaining control. It would also place XRP back near the lower edge of its former range.
Lower Macro Supports Remain In Focus
The nearest support zone is between $1.30 and $1.35. XRP is still holding this area, but repeated tests show growing pressure.
A daily close below $1.30 could open the path toward lower levels. The next support area sits near $1.15 to $1.20.
If selling continues, traders may also watch the broader $1.00 region. Some market watchers have also pointed to Coinbase levels near $1.10 and $0.87.
These zones are viewed as lower macro support areas. They may attract attention if XRP loses its current base.
However, a move into those levels would require further weakness below near-term support. The chart also shows that XRP has lost several rising support angles.
The Fibonacci fan structure places price below lower support lines. This keeps the asset in a defensive market position.
Read Also:
Momentum Indicators Show Weak Buying Strength
Momentum readings also remain soft on the daily chart. The MACD line is below the signal line, and both lines are near zero.
This shows weak momentum, with a mild bearish bias. The histogram is negative, but it is not deeply stretched.
That means selling pressure is present, while downside speed remains limited. Traders may still wait for a clearer momentum shift.
The RSI is near 39, while its moving average is around 45. This places XRP below the neutral 50 level. It also shows that buyers have not regained broad control.
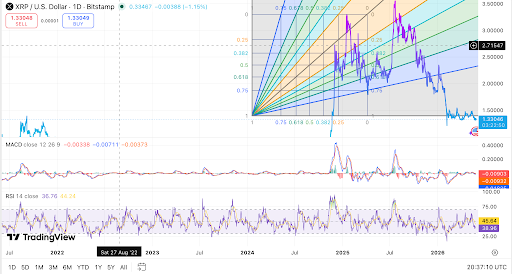 XRP trades near support as $1.65 resistance blocks recovery. Source: TradingView.
Still, the RSI is not deeply oversold. This means the chart does not yet show a clear exhaustion reading.
A stronger recovery may need better momentum and higher daily closes. XRP now needs to reclaim $1.45 to $1.50 for short-term strength.
A move above $1.65 would be the first stronger recovery signal. Until then, the risk of a final flush remains active.
The post XRP Faces Final Flush Risk As $1.65 Resistance Blocks Recovery Move appeared first on Live Bitcoin News.


Ayrıca Şunları da Beğenebilirsiniz
How Will XRP Price React After the FOMC Meeting Today?

How to Spot a South African Cyber-Scam Before You Click “Pay”

Cryptopolitan Launches Crypto Data Dashboards and Becomes the First Media Platform with Full Agentic AI Access


Popüler Haberler
Daha fazla
