

Shiba Inu Price Prediction: Oversold Signals Point to a Short-Term SHIB Rebound
Key highlights:
- The SHIB price is testing key support as oversold signals hint at a rebound.
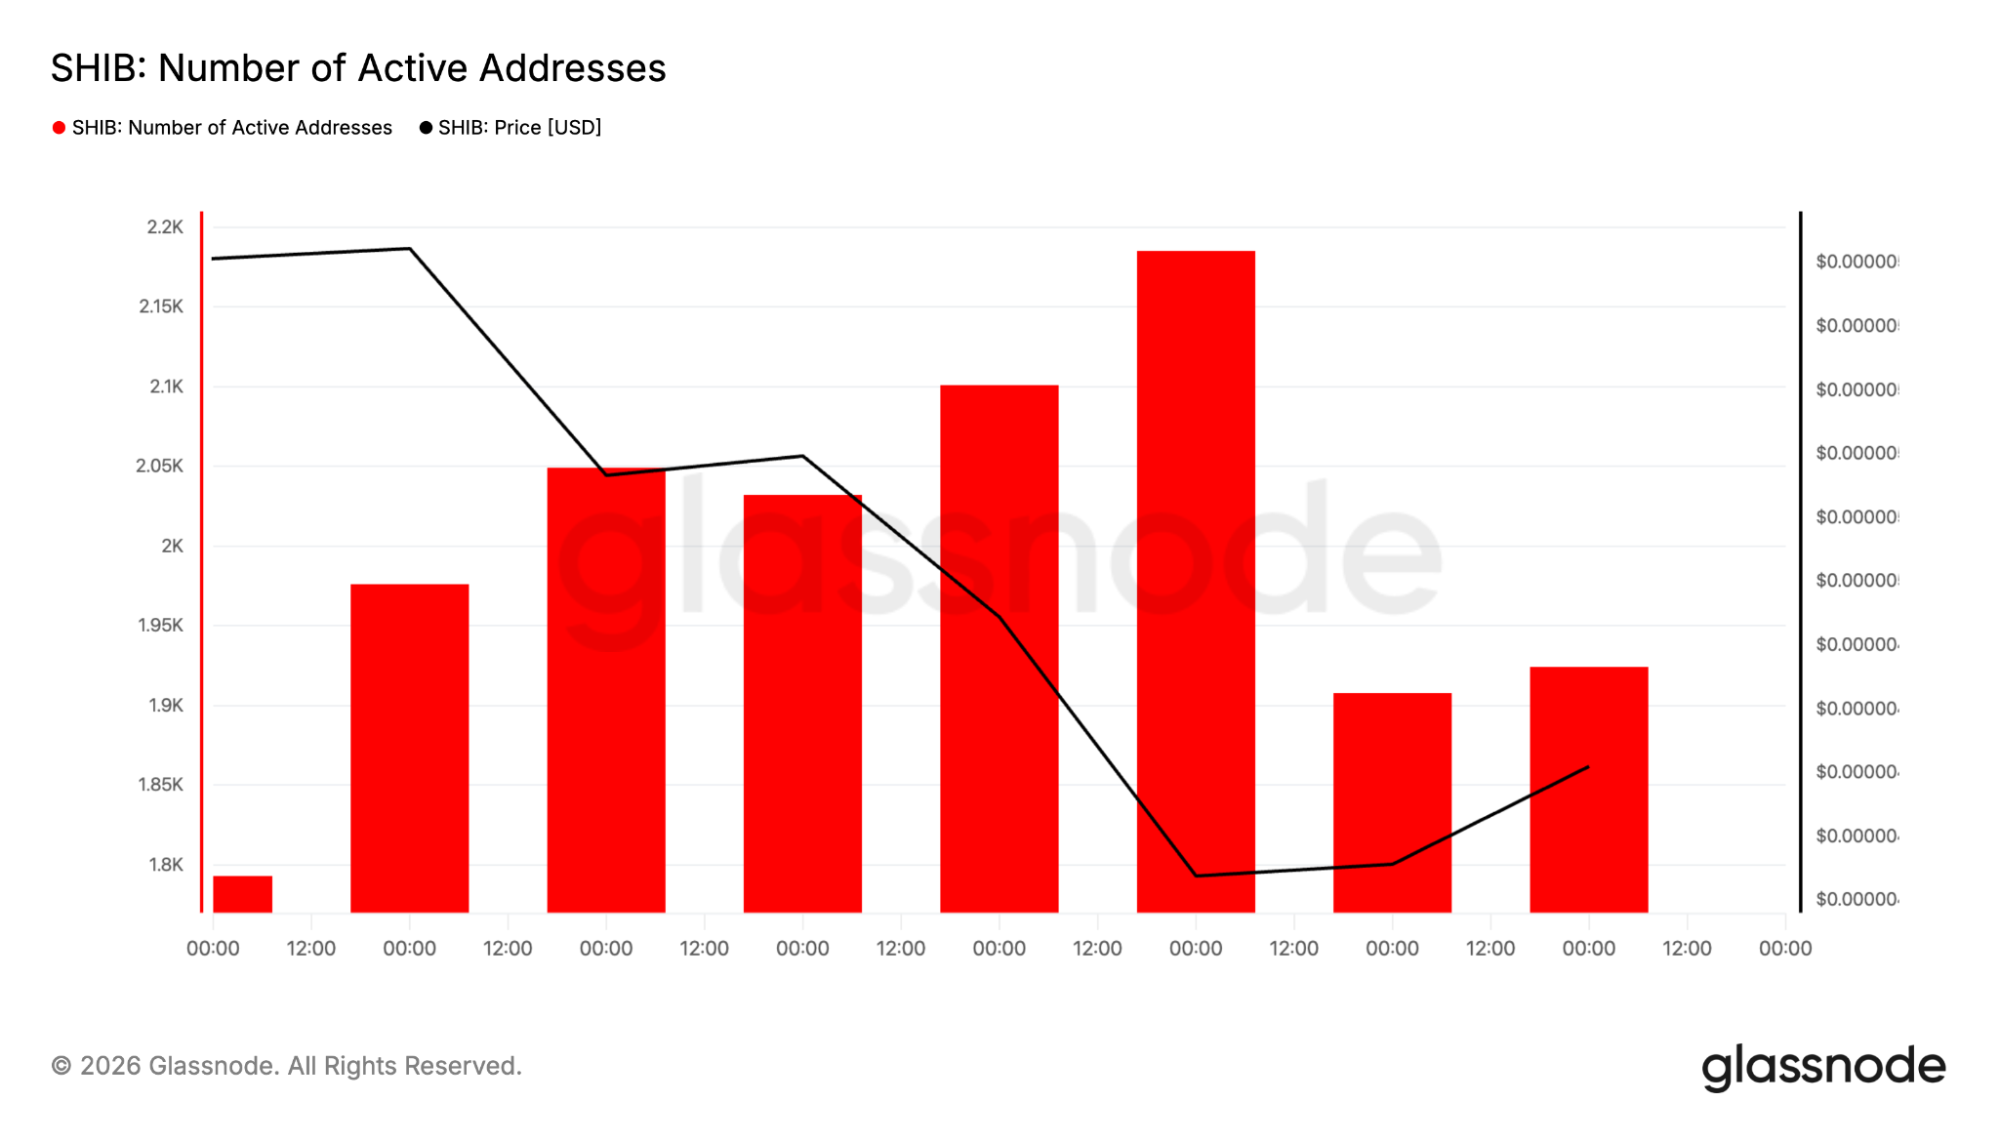
- On-chain activity is improving, with transfers above 3,800 and active addresses near 2,300.
- Exchange outflows of 1.91 trillion SHIB and a 1,034% jump in burns continue tightening supply.
Shiba Inu has not been smooth sailing in the last few weeks. The SHIB price is currently trading at $0.00000470, hovering around one of its crucial support lines following a period of continuous fall which saw the coin fall below some critical technical levels.
Looking only at the chart, the picture still favors sellers. The trend remains pointed lower, and every recovery attempt has been met with fresh selling. But once you move beyond price action, a different story starts to emerge.
Network activity is increasing, transfers are climbing, and active wallets are becoming more engaged even as the SHIB price trades near multi-month lows. That disconnect has many traders asking whether the market is quietly building a base for a recovery.
The SHIB chart still belongs to the bears
We had a look at both the 4-hour and daily charts, and the trend remains under pressure. On the 4-hour chart, the SHIB price trades near $0.00000470 which is well below the 100-period SMA of $0.00000527.
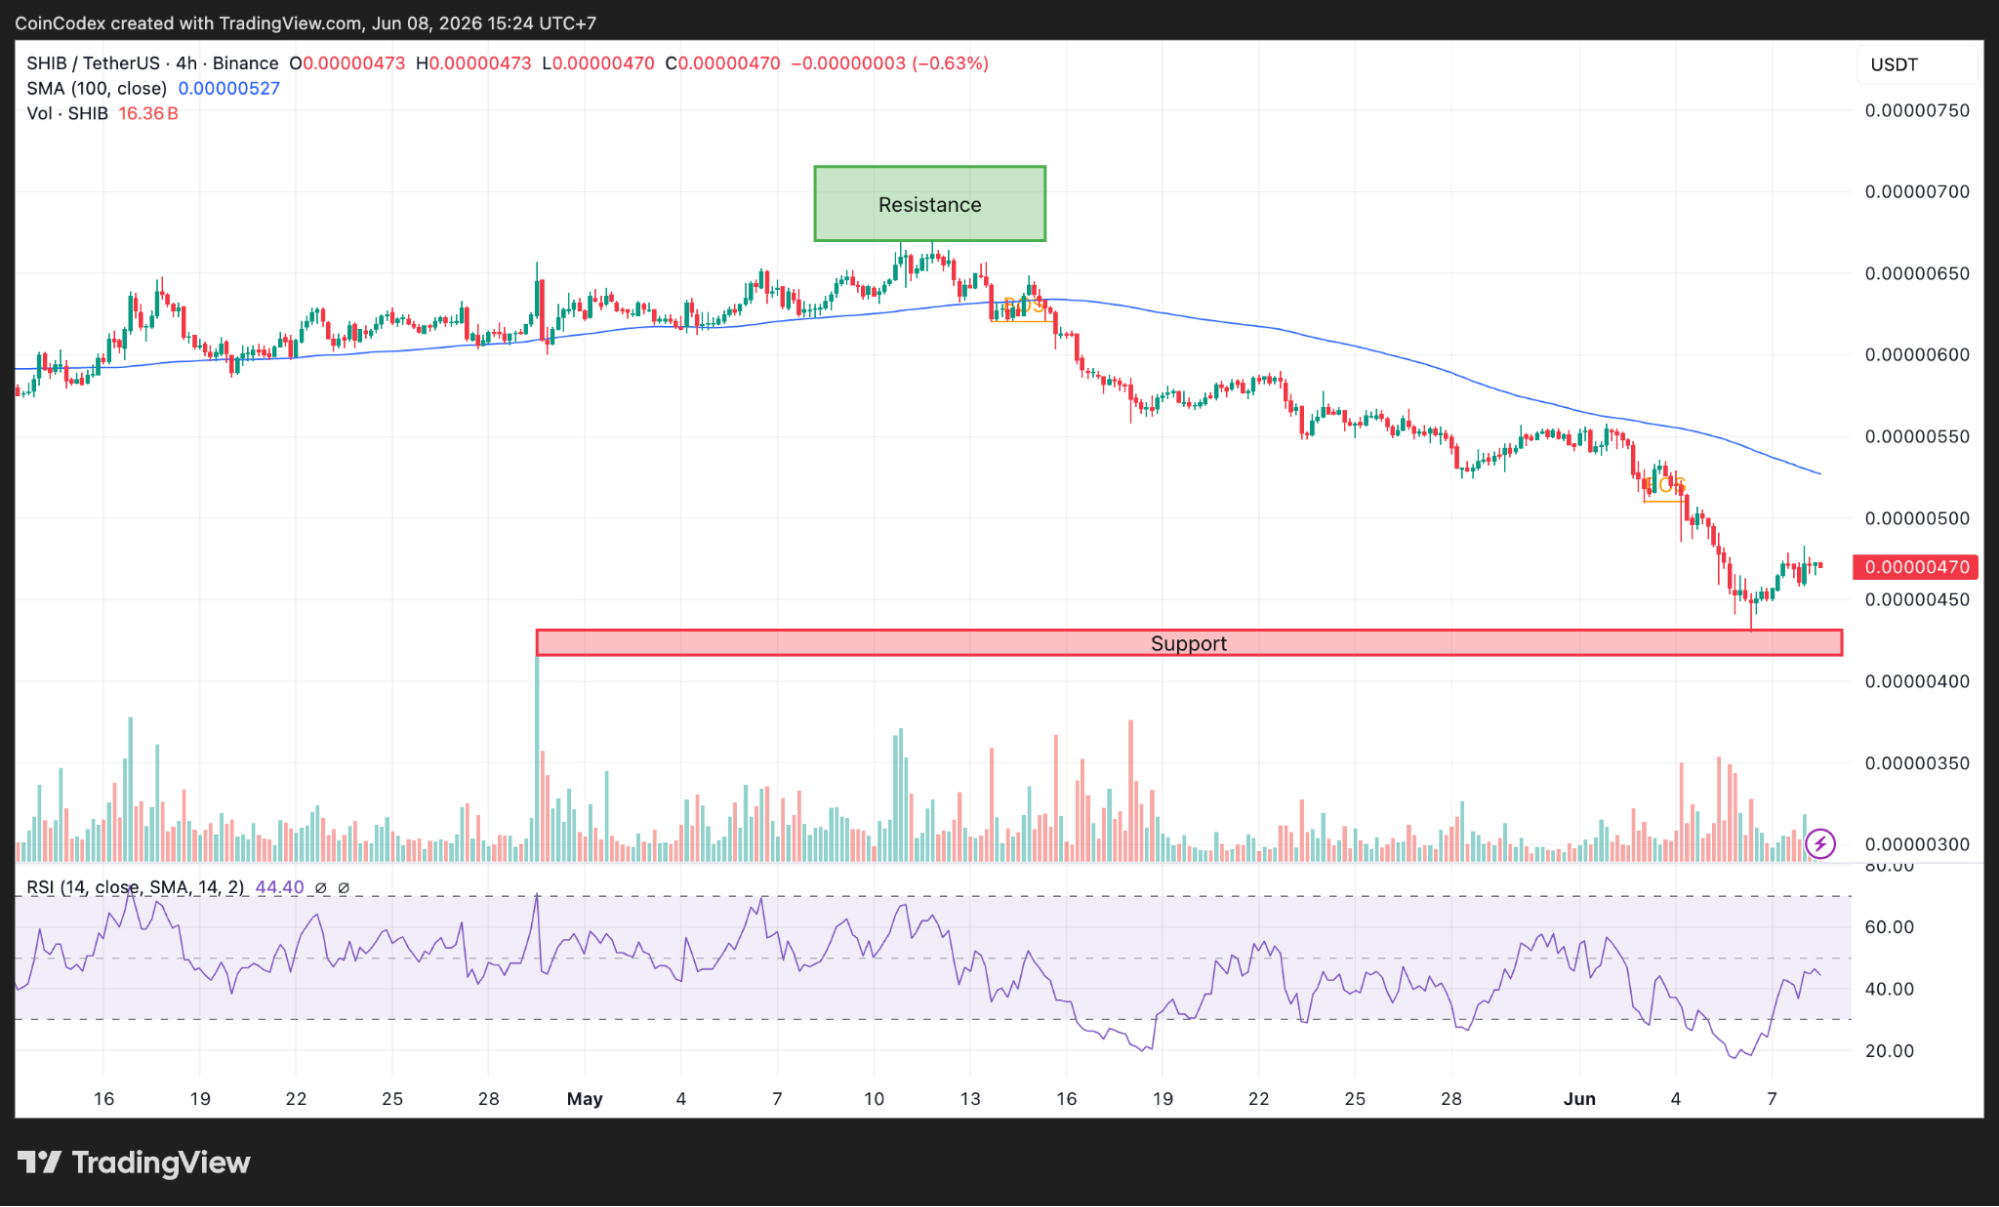
4-hour SHIB chart analysis
The price action on the charts prints lower highs and lows, showing the sellers' dominance of the shorter-term direction, although momentum starts to slow down. The Relative Strength Index currently trades near 44.40 and approaches the oversold levels from which it traded for several weeks in a row.
The picture becomes more obvious in the case of the daily chart. The price lost support near the 100 SMA at $0.00000585, showing that the larger correction is in progress. On the other hand, the daily RSI reached 26.69 and printed the oversold reading.
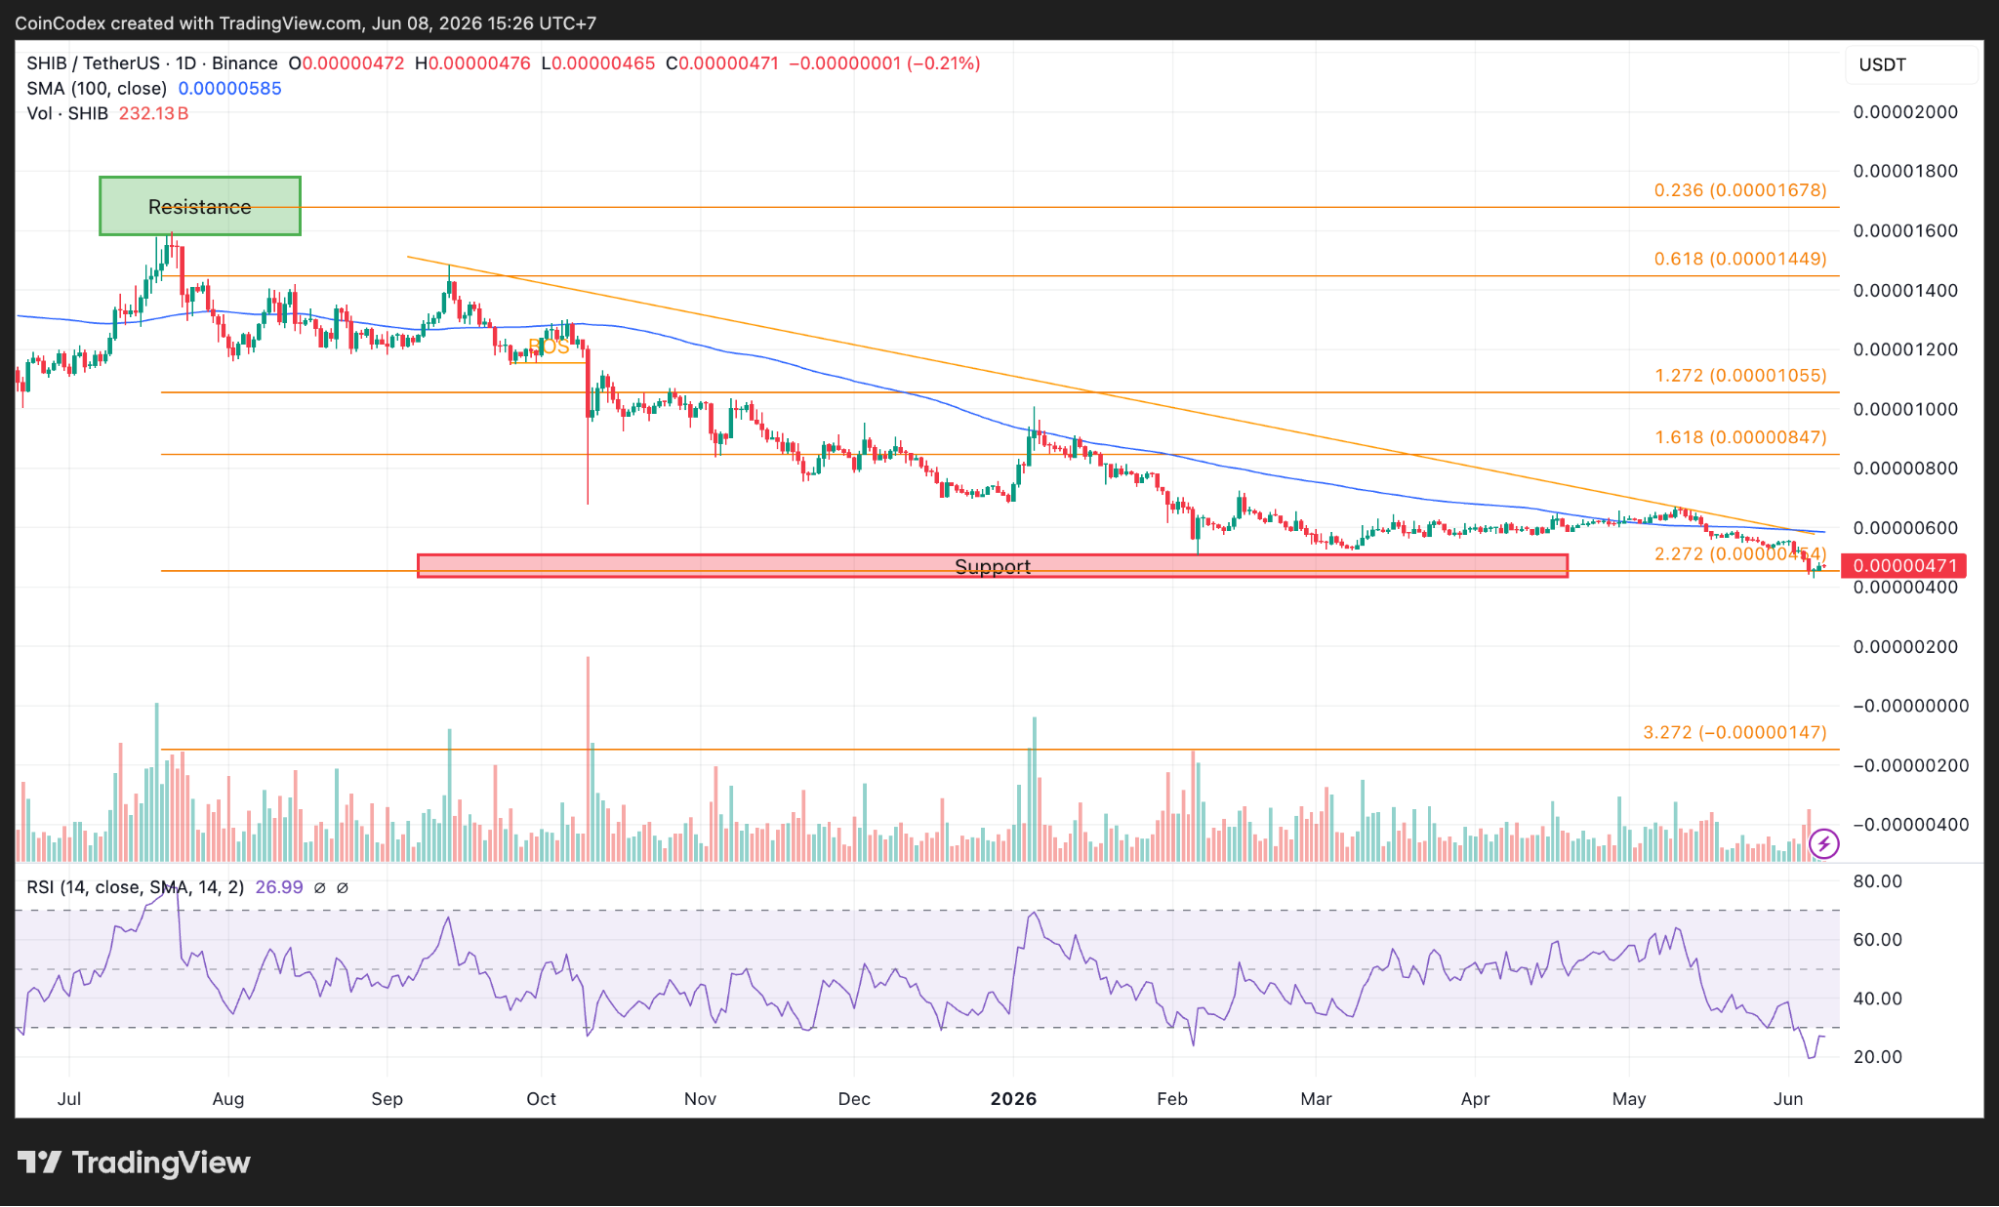
Daily SHIB chart analysis
It does not necessarily mean that the downtrend is coming to its end. However, in most cases, when the markets reach these oversold readings, they start to show some signs of relief, as markets do not move in one direction forever.
As far as technical levels go, the support region lies between $0.00000470 and $0.00000480. Retaining these levels will allow the price to head towards $0.00000520, while the breakdown below support will bring further losses to the price in the range of $0.00000440-$0.00000450.
SHIB on-chain activity is moving in the opposite direction
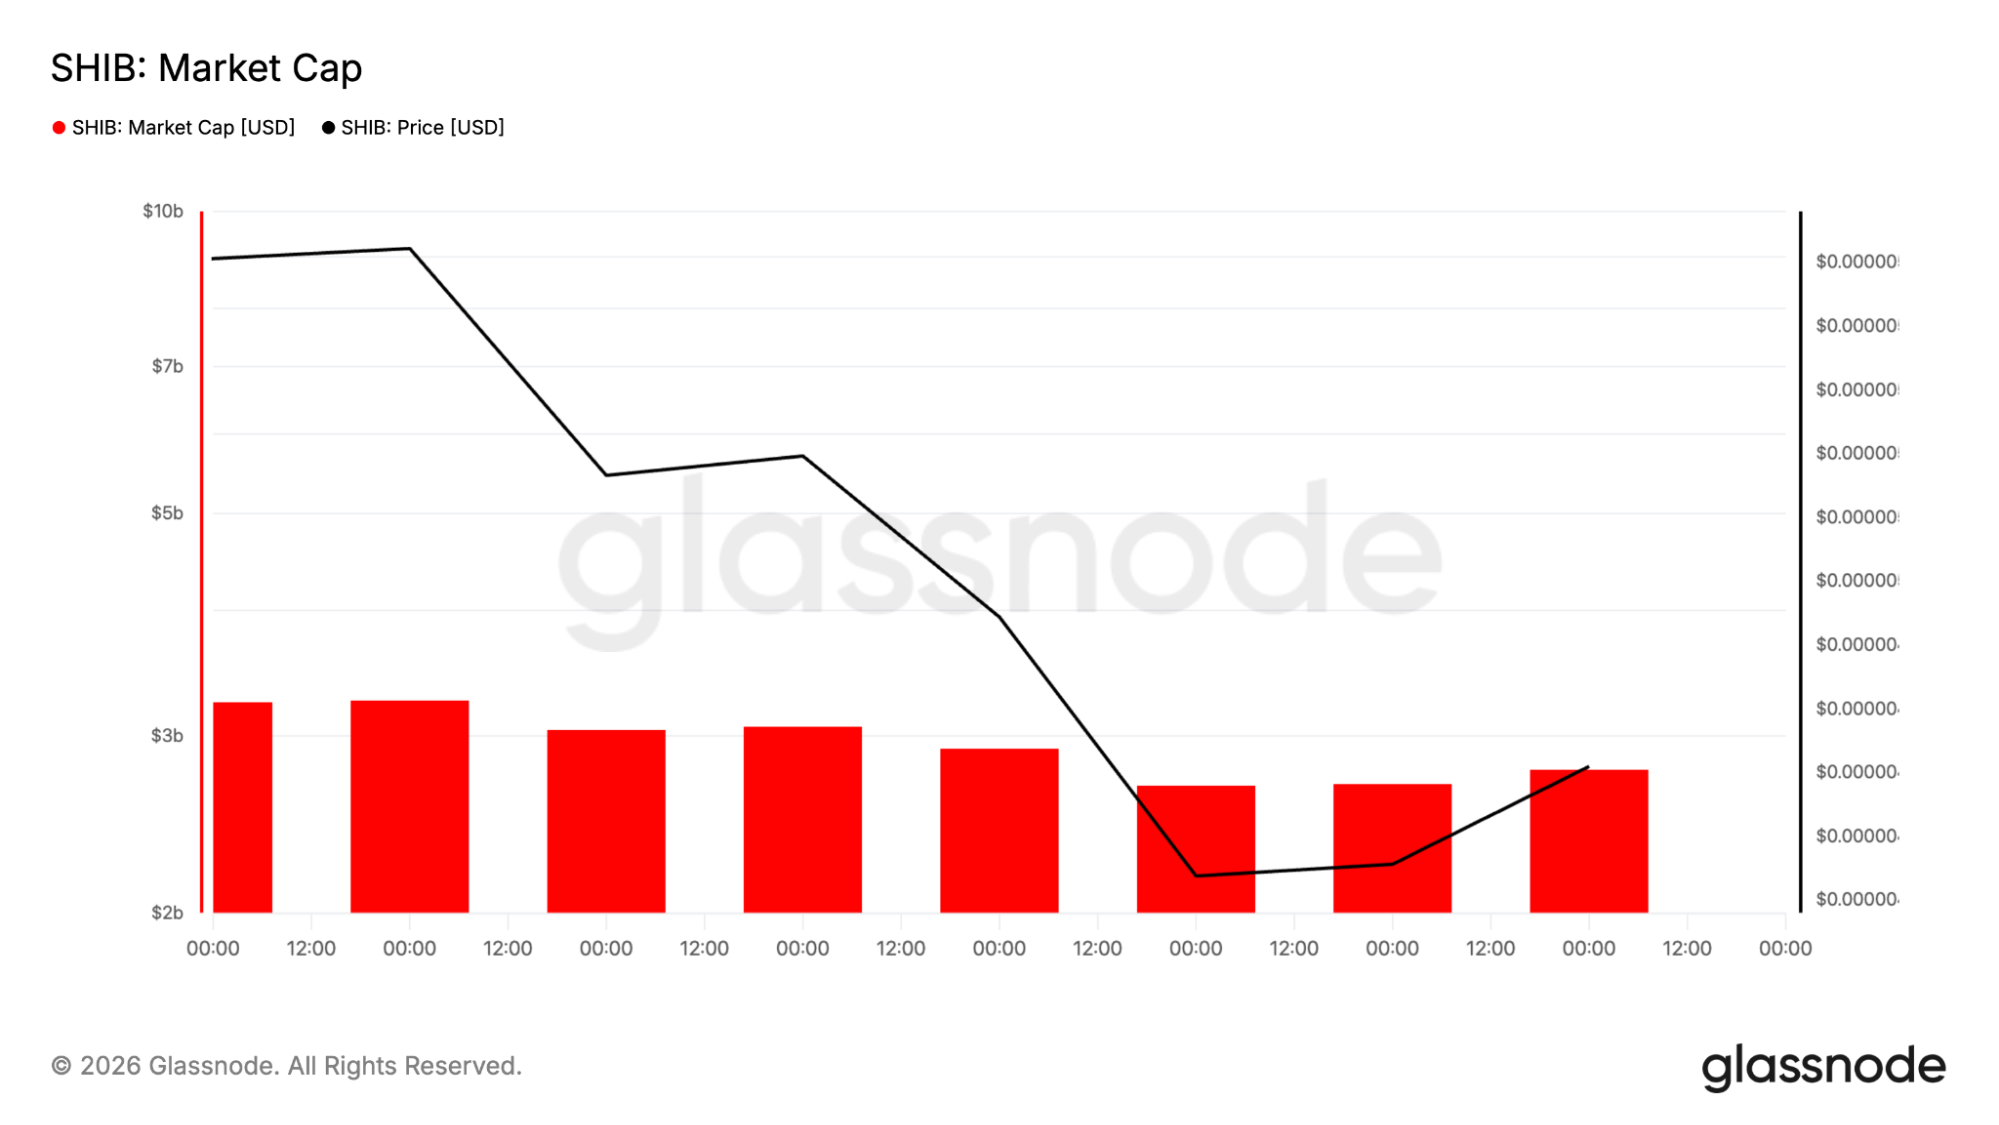
Price has struggled, but blockchain data tells a much more encouraging story. The biggest negative number remains market capitalization. SHIB's market value has dropped from more than $9 billion earlier in the cycle to roughly $2.7–$2.8 billion, showing that a large amount of capital has exited the market.
At the same time, network usage is improving. The amount of transfers has been rising rapidly, having risen from an average of about 1,500 daily transfers to more than 3,800 transfers, which has been one of the highest levels seen throughout the whole timeframe. This indicates that people continue to transfer SHIB tokens despite the fact that its price continues to fall.
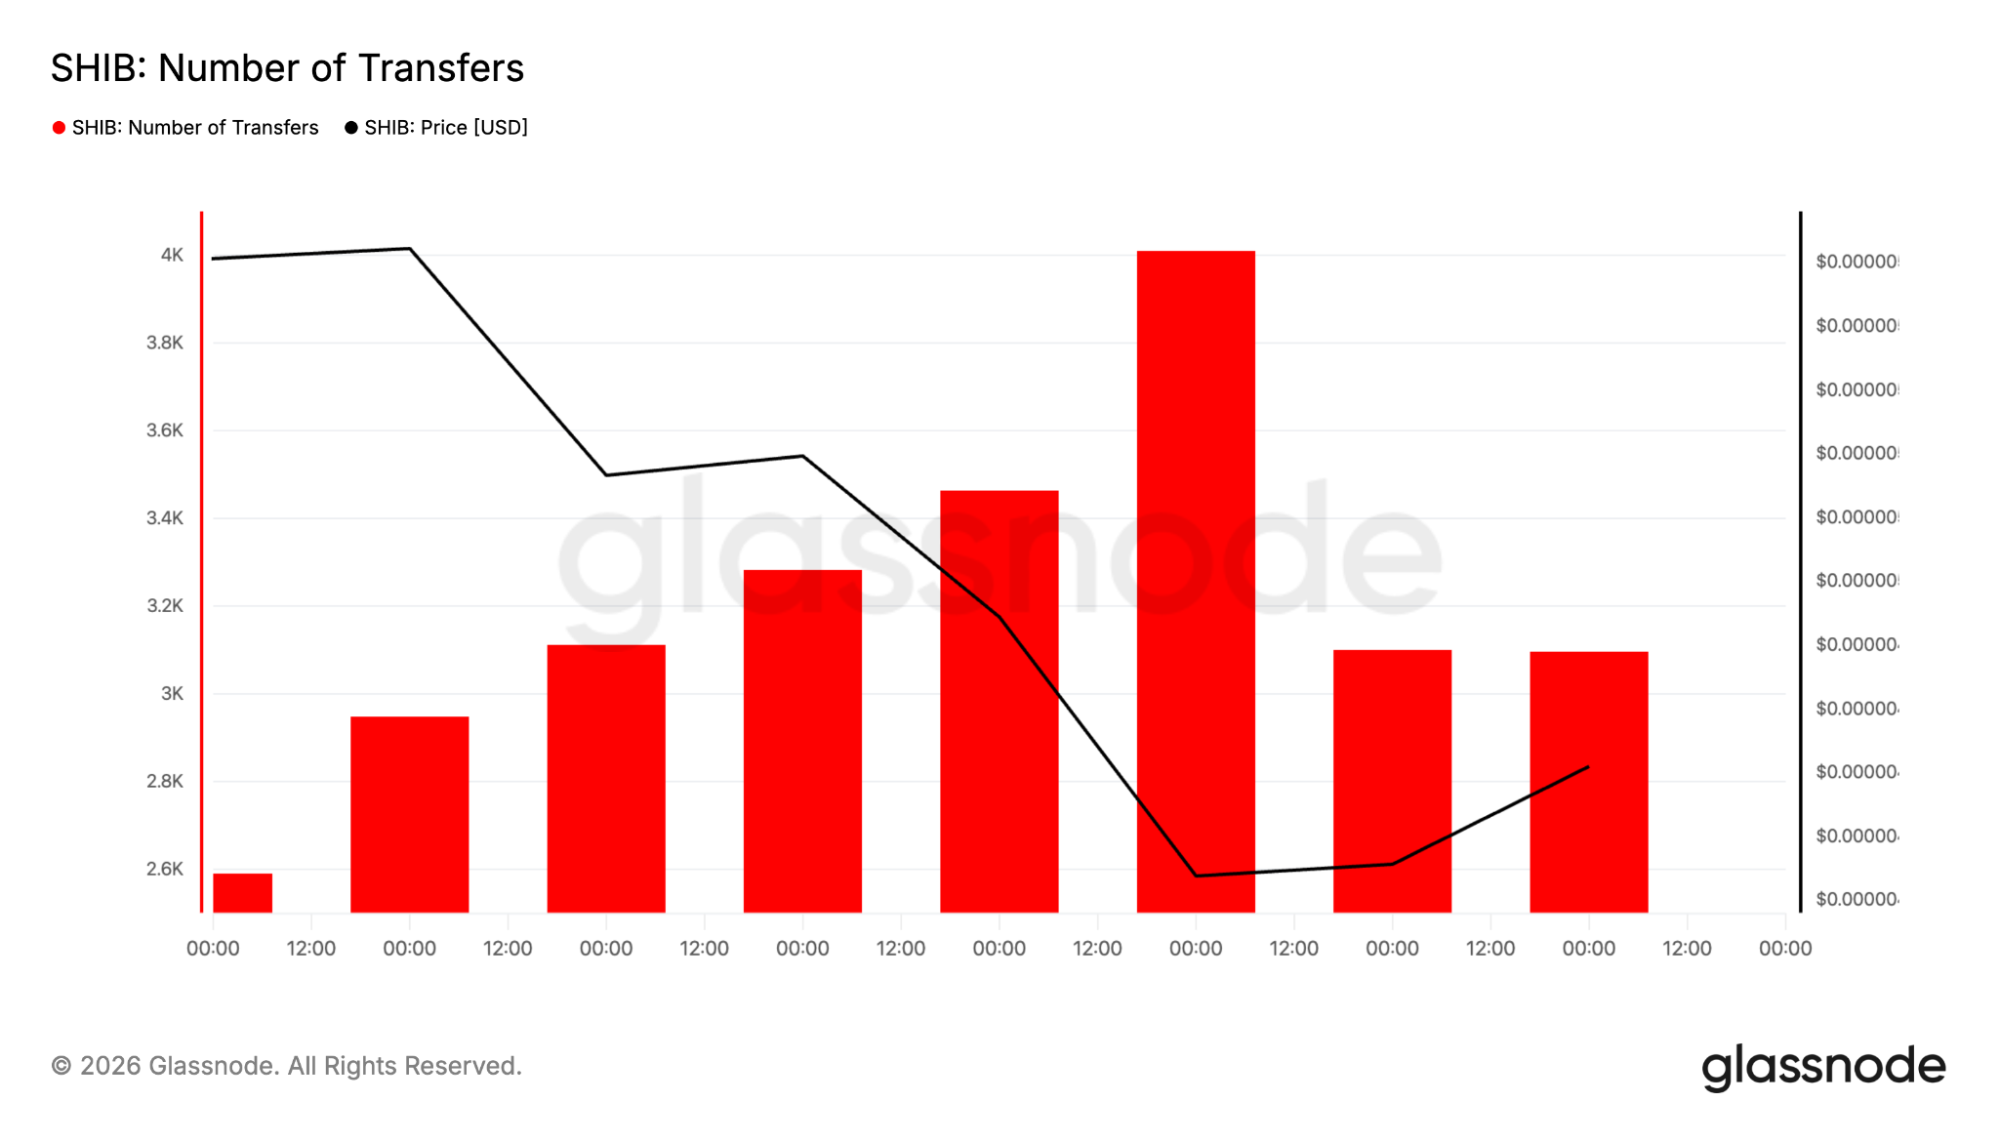
The number of active addresses has also increased similarly. Activity among addresses has bounced back from an average of about 900 addresses to roughly 2,300 addresses. This combination creates a positive divergence. Valuation has fallen, but actual activity is picking up.
SHIB supply dynamics continue to strengthen
Supply dynamics also provide support for the SHIB price. Blockchain data shows approximately 1.91 trillion SHIB tokens moved off exchanges within 24 hours. Exchange outflows reduce the amount of readily available supply, making it harder for large sell orders to hit the market.
The community burn mechanism is also contributing. Daily burn activity recorded an increase of 1,034%, permanently removing additional SHIB from circulation. Every token burned reduces supply, which can amplify price moves if demand improves.
There is still volatility to consider. A dormant whale transferred 400 billion SHIB, reminding investors that large holders remain capable of influencing short-term price action. Even so, lower exchange balances and continuous burns create conditions that become increasingly favorable if buying interest returns.
The SHIB ecosystem is still expanding
Developments within the Shiba Inu ecosystem have not slowed either. The project team is still busy improving the Shibarium network, including the Shib Alpha Layer that seeks to reduce transaction times and make the process of building new applications easier.
Another topic of interest is artificial intelligence, as the TokenPlayAI partnership is set to see a technical paper published soon that will map out plans moving forward. Regulatory news also adds credence to the project.
The SEC acknowledges SHIB as a digital commodity, while Japan put SHIB alongside other prominent cryptos such as Bitcoin and Ethereum on their Green List. Finally, T. Rowe Price filed an ETF application that includes SHIB among other tokens.
None of these can be directly linked to increased value anytime soon, yet they do add to the solid foundation of this project and open up more avenues to institutional investors.
Where could the SHIB price go next?
SHIB continues to be within the bear market framework, while the recovery to the moving averages may not happen soon. Yet there are some signals that the underlying situation may get better.
In case buyers manage to hold the support level at $0.00000470, SHIB can go for a retest of $0.00000520, before heading for the crucial resistance zone at $0.00000527–$0.00000585. Otherwise, the focus may shift to the area at $0.00000440–$0.00000450, extending the correction further.
For now, the SHIB price still favors caution, but the growing gap between weak price action and improving on-chain activity is becoming difficult to ignore. CoinCodex’s 1-month SHIB price prediction places the SHIB price at $0.000004741, which is slightly above current trading level.


Ayrıca Şunları da Beğenebilirsiniz

Trump attack on First Amendment receives major 'benchslap' from judge

Mozambique-Italy Business Mission Targets Infrastructure
Egrag Crypto: This Fresh XRP Signal Could Set the Stage for Major Reversal


Popüler Haberler
Daha fazla
