

XRP Price Troubles Aren’t Over Yet As Downside Risks Mount
XRP price started a downside correction below the $1.150 zone. The price is now showing bearish signs and might decline further below $1.080.
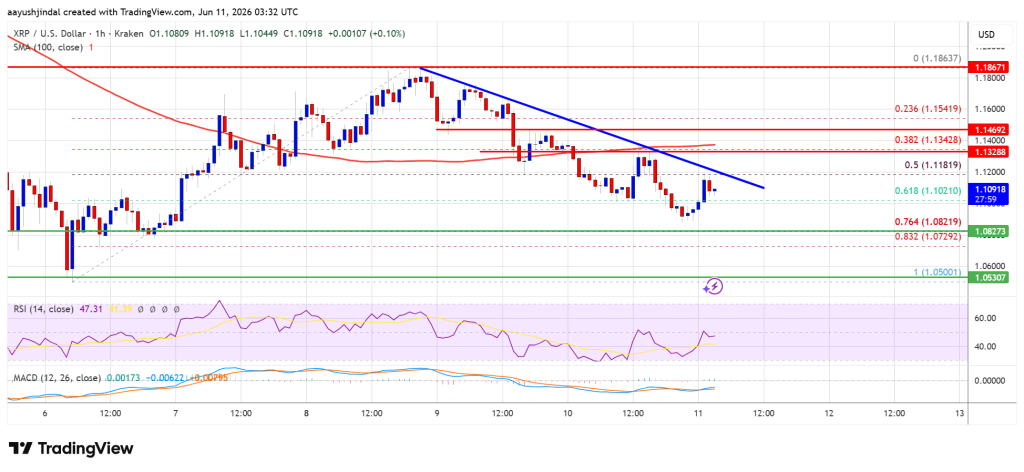
- XRP price started a downside correction after it failed to stay above the $1.1550 zone.
- The price is now trading below $1.1350 and the 100-hourly Simple Moving Average.
- There is a bearish trend line forming with resistance at $1.120 on the hourly chart of the XRP/USD pair (data source from Kraken).
- The pair could continue to move down if it stays below $1.1350.
XRP Price Turns Red
XRP price struggled to stay above $1.1550 and started a fresh decline, like Bitcoin and Ethereum. The price dipped below the $1.150 and $1.1420 levels.
The price even traded below the 50% Fib retracement level of the upward move from the $1.050 swing low to the $1.1862 high. However, the bulls are currently protecting the $1.10 support zone. Besides, there is a bearish trend line forming with resistance at $1.120 on the hourly chart of the XRP/USD pair.
The price is now trading below $1.1350 and the 100-hourly Simple Moving Average. If there is a fresh upward move, the price might face resistance near the $1.120 level. The first major resistance is near the $1.1350 level, above which the price could rise and test $1.1420.
A clear move above the $1.1420 resistance might send the price toward the $1.1550 resistance. Any more gains might send the price toward the $1.1650 resistance. The next major hurdle for the bulls might be near $1.1840.
Downside Continuation?
If XRP fails to clear the $1.1350 resistance zone, it could start a fresh decline. Initial support on the downside is near the $1.10 level. The next major support is near the $1.080 level or the 76.4% Fib retracement level of the upward move from the $1.050 swing low to the $1.1862 high.
If there is a downside break and a close below the $1.080 level, the price might continue to decline toward $1.0650. The next major support sits near the $1.050 zone, below which the price could continue lower toward $1.020. Any more losses might call for a test of $1.00.
Technical Indicators
Hourly MACD – The MACD for XRP/USD is now losing pace in the bearish zone.
Hourly RSI (Relative Strength Index) – The RSI for XRP/USD is now below the 50 level.
Major Support Levels – $1.1000 and $1.080.
Major Resistance Levels – $1.1200 and $1.1350.


Ayrıca Şunları da Beğenebilirsiniz

Nigeria invests $9m in research to drive digital economy ambitions

US Dollar Index Rebounds as US-Iran Ceasefire Talks Fuel Uncertainty

Ethereum reserves on exchanges hit an all-time low at 14.5 million! What could this signal for ETH investors?


Popüler Haberler
Daha fazla
