

Bitcoin (BTC) Price: Extreme Fear, ETF Outflows, and a Potential Bottom — Where Does BTC Go From Here?
TLDR
- Bitcoin is trading near its 200-week moving average, a level historically seen at the end of bear markets
- The Crypto Fear and Greed Index has dropped to 9, deep in “extreme fear” territory
- CryptoQuant puts a potential structural bottom near $53,600, Bitcoin’s current realized price
- US CPI inflation hit 4.2% annually in May, the highest since early 2023, adding pressure on BTC
- Derivatives markets are showing some buying activity, with BTC futures open interest rising nearly 2% to $45.71 billion
Bitcoin is trading near a level that has only appeared in the deepest parts of past bear markets. On Thursday, BTC changed hands at around $62,150–$62,623, up roughly 2% on the day but still lower on the week.
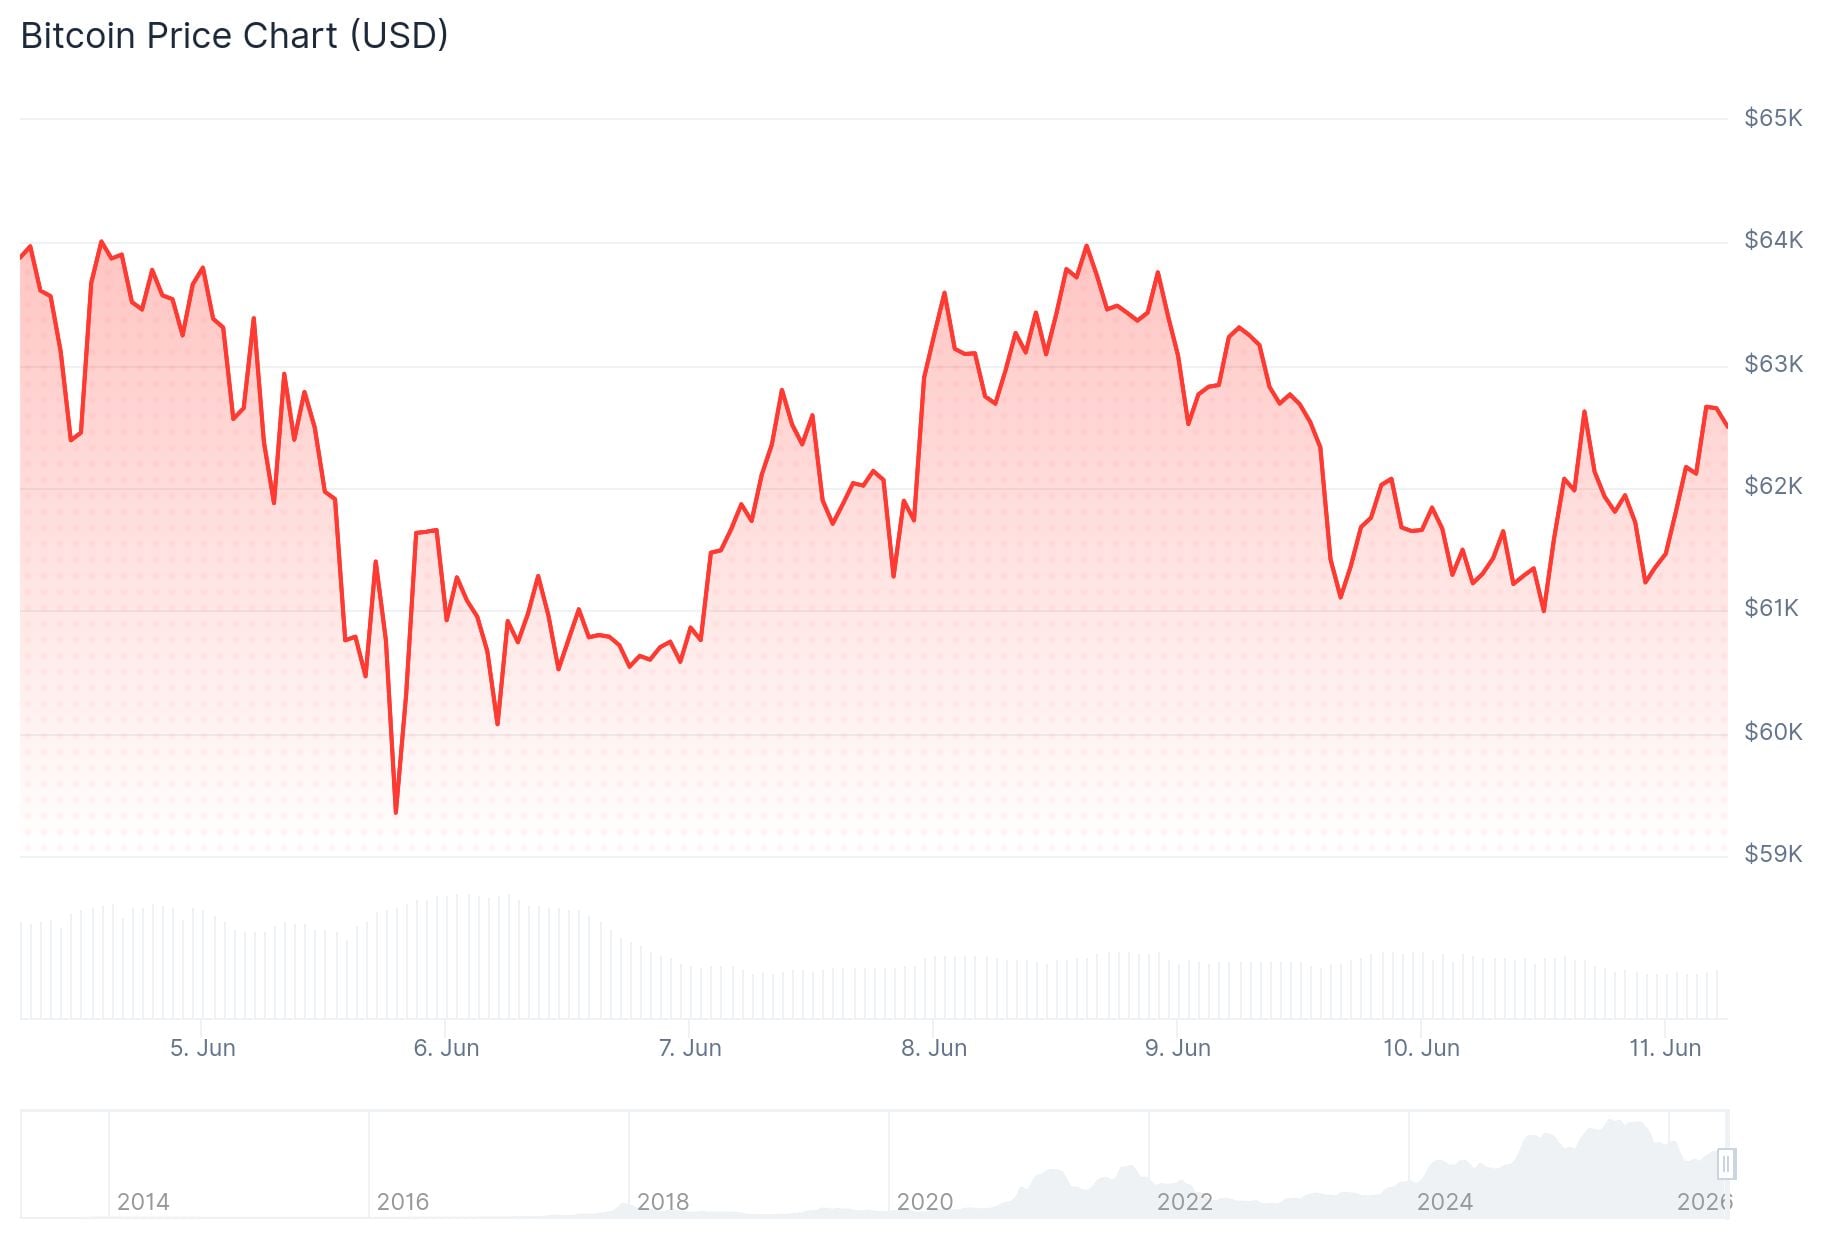 Bitcoin (BTC) Price
The coin briefly broke below $60,000 earlier this week — its first time there since 2024.
Blockchain analytics platform Checkonchain shows BTC has fallen close to its 200-week moving average. This places Bitcoin in the bottom 10% of its entire historical valuation range.
The Crypto Fear and Greed Index sits at 9 out of 100. That is down from 11 last week and 48 just a month ago.
Wu Blockchain shared data from CryptoQuant on social media, highlighting that the analytics firm sees Bitcoin’s potential bottom near $53,600, its current realized price. CryptoQuant head of research Julio Moreno said the realized price is “a level that would confirm a bottom” historically, but stressed this is only a “valuation bottom candidate,” not a confirmed cycle low.
Moreno added that a true recovery requires a “constructive demand recovery, a condition not yet visible in the data.” CryptoQuant’s data shows total demand fell by 652,000 BTC last week, and 30-day ETF demand growth dropped to -74,000 BTC.
ETF Outflows and Macro Pressure
US consumer prices rose 4.2% year-over-year in May, the fastest pace since early 2023. Energy costs tied to the US-Iran conflict pushed headline inflation higher, though core CPI came in softer than expected.
Yves Renno, Head of Trading at Wirex, noted that Polymarket odds of the US Clarity Act passing in 2026 dropped from 62% to 48% this week. He said the June 16–17 FOMC meeting will be key, with Bitcoin either bouncing toward $68,000–$72,000 or breaking below $60,000 depending on the Fed’s tone.
ETF outflows remain a drag. Record net outflows have pulled institutional money out of Bitcoin products for several consecutive sessions.
On-Chain Signals and Derivatives Activity
Cycle analyst Benjamin Cowen says the four-year cycle remains intact and he expects Bitcoin to likely bottom around October. He highlighted that Bitcoin is currently bouncing from the 200-week moving average, and that the price is trading in the Fibonacci Golden Zone on the weekly chart.
Other analysts have flagged the possibility of a double bottom forming on the daily chart, with large support volumes in the current range.
CoinGlass data shows BTC futures open interest rose nearly 2% in 24 hours to $45.71 billion. CME, Binance, and OKX each saw open interest climb 5%, 2%, and 4% respectively.
Glassnode reported that short-term holders are sitting in losses and realized losses are accelerating, while options markets continue to price in elevated risk.
As of Thursday, BTC was trading at approximately $62,150, with the broader crypto market posting modest gains that have not reversed this week’s losses.
The post Bitcoin (BTC) Price: Extreme Fear, ETF Outflows, and a Potential Bottom — Where Does BTC Go From Here? appeared first on CoinCentral.


Ayrıca Şunları da Beğenebilirsiniz

Moonshot MAGAX vs Shiba Inu: The AI-Powered Meme-to-Earn Revolution Challenging a Meme Coin Giant

Nigeria invests $9m in research to drive digital economy ambitions

US Dollar Index Rebounds as US-Iran Ceasefire Talks Fuel Uncertainty


Popüler Haberler
Daha fazla
