Solana (SOL) Price: Can SOL Flip $100 as Network Activity Hits New Highs?
TLDR
- Solana (SOL) is testing its 50-day EMA near $75, a level that could open the door to further gains.
- Retail traders are turning more bullish, shown by rising funding rates and stable Open Interest above $5 billion.
- Institutional demand is mixed, with SOL ETFs logging a $2.50 million outflow after a $5.52 million inflow the day before.
- Grayscale data shows Solana processing about 100 million daily transactions and serving 4.3 million daily users.
- Analyst Michaël van de Poppe says a break above $77 could send SOL toward $125-$130.
Solana is trading near $75 on Wednesday. The token is testing its 50-day Exponential Moving Average, a level traders watch closely for signs of momentum.
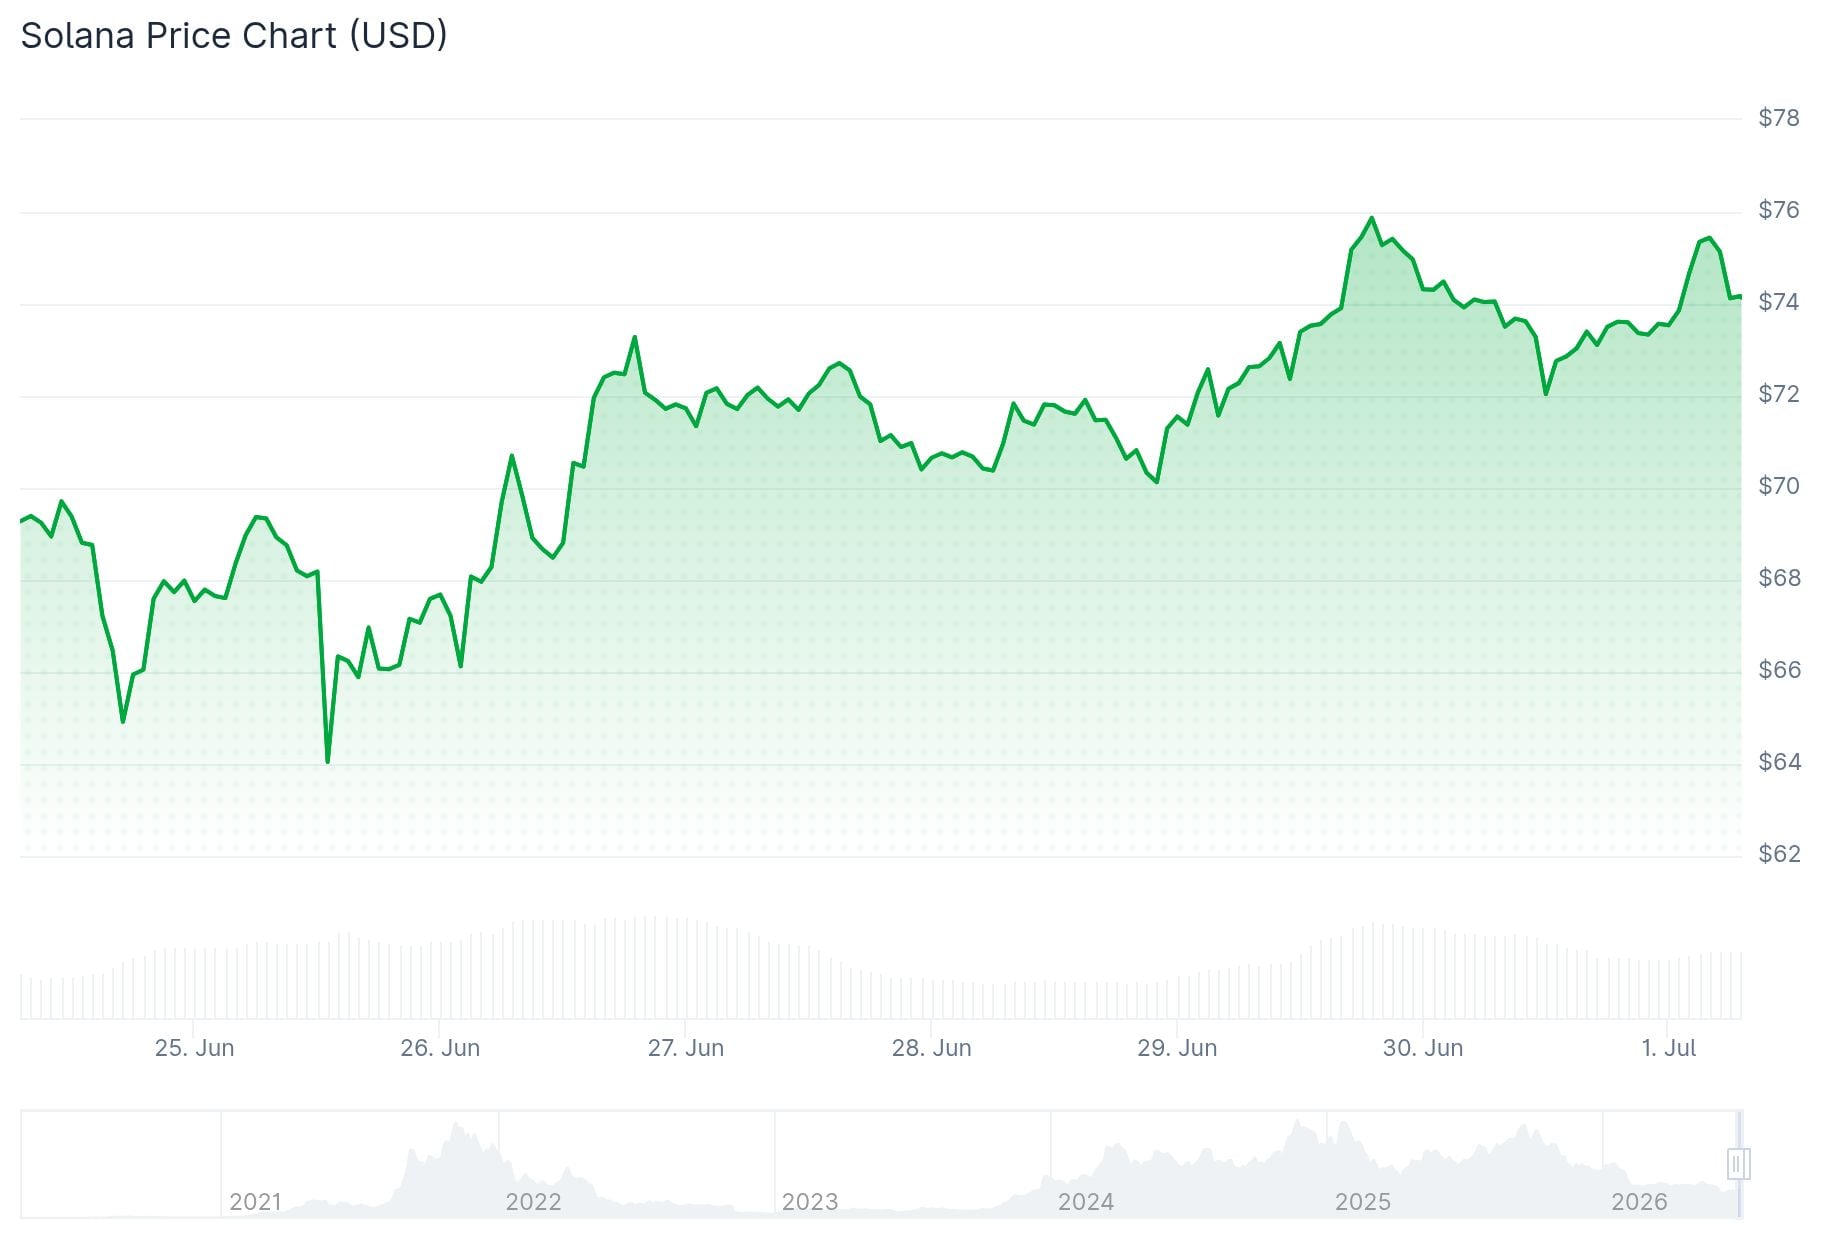 Solana (SOL) Price
A close above this average could open the path toward the 200-day EMA, which sits close to $98.79. That would put SOL within reach of the $100 mark for the first time in weeks.
Retail interest appears to be picking up. CoinGlass data shows Open Interest at $5.33 billion, holding steady above $5 billion after a drop last month.
Funding rates, which measure demand for long positions in derivatives markets, rose to 0.0073% on Wednesday. That suggests traders are willing to pay a premium to stay bullish on SOL.
Institutional Flows Tell a Different Story
ETF activity has been less consistent. SOL-focused funds saw $2.50 million in outflows on Wednesday, a reversal from the $5.52 million inflow recorded the day before.
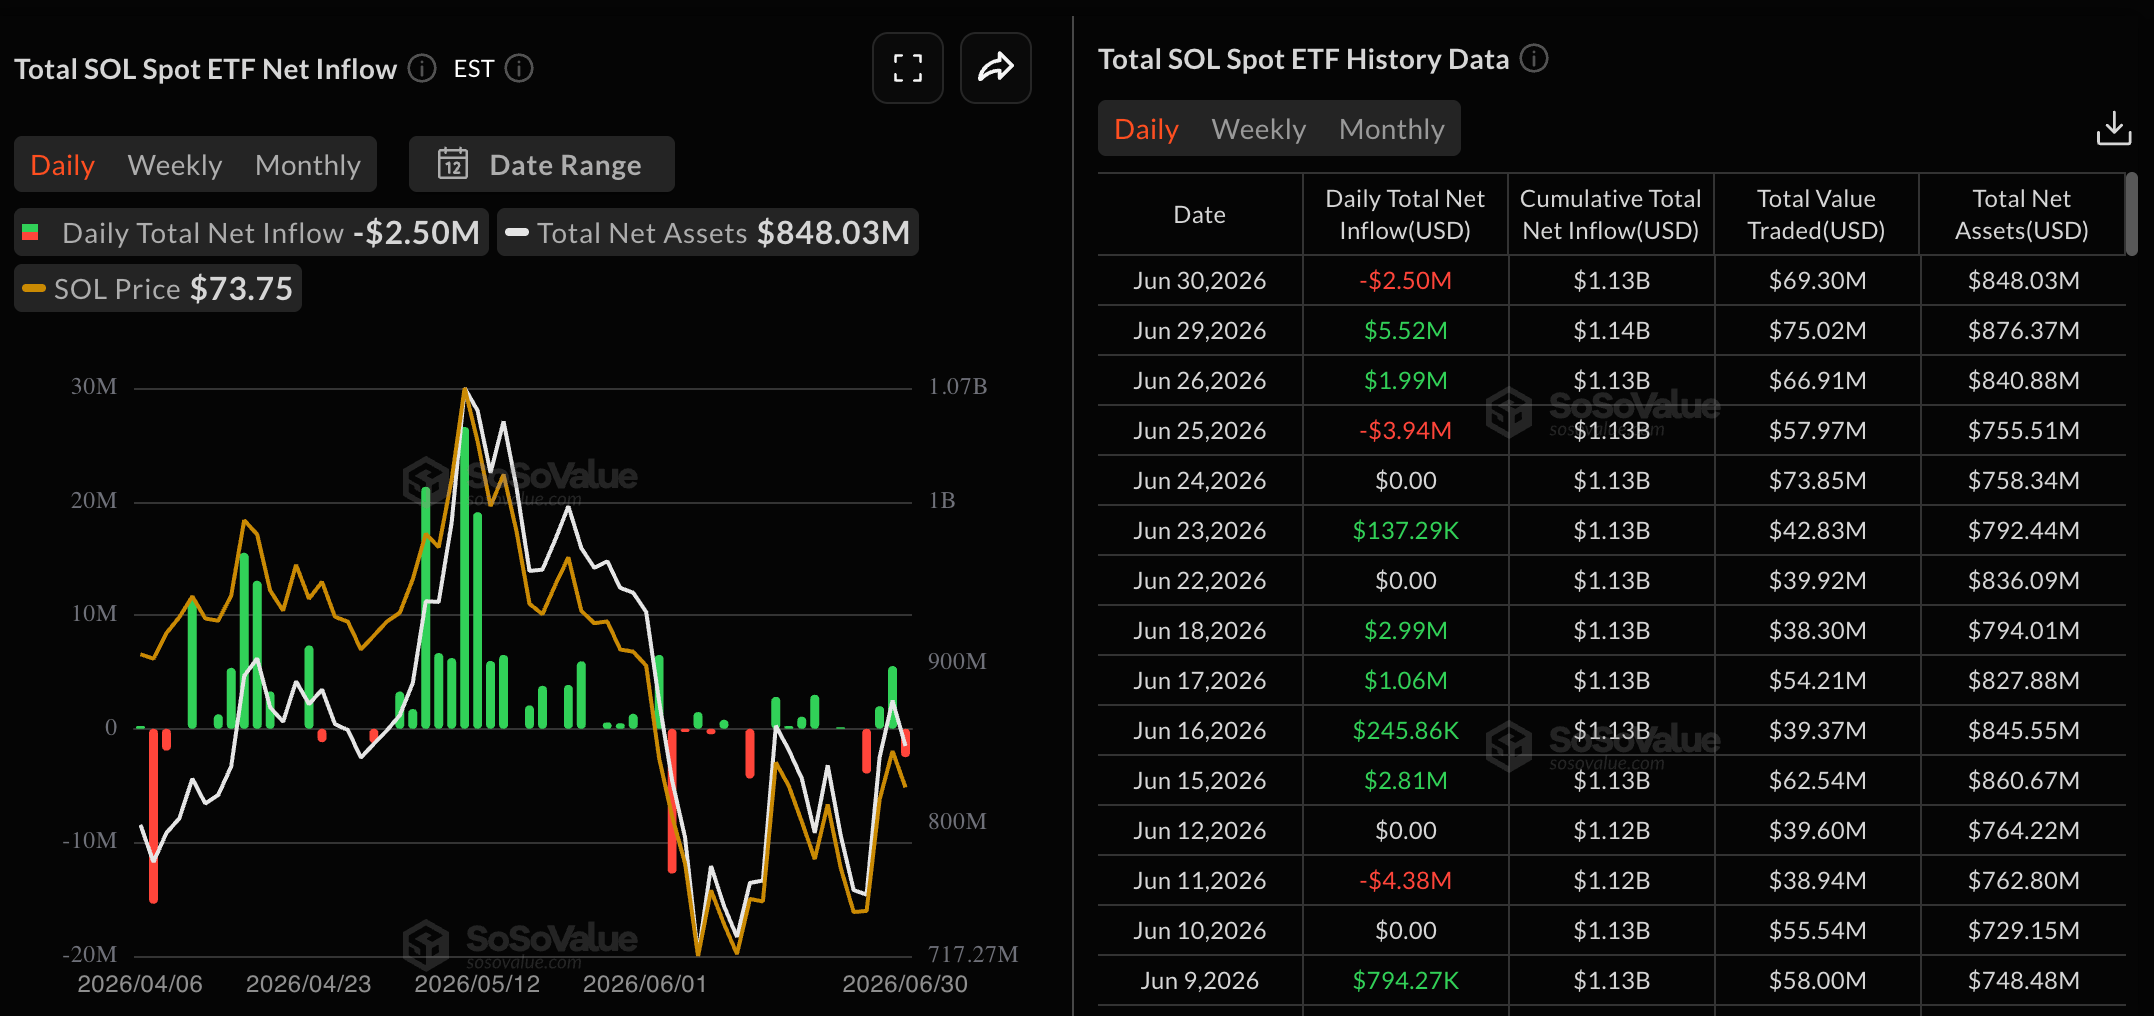 Source: SoSoValue
That back-and-forth pattern points to institutions holding a wait-and-see stance rather than committing to a clear direction.
On the charts, momentum indicators lean positive. The Relative Strength Index sits at 55, just above the midpoint, while the MACD line is climbing toward positive territory.
If SOL fails to hold the 50-day EMA, traders may watch for a drop back toward the February 6 low of $67.50. A deeper break below the $60 zone would weaken the broader price structure.
Analyst Michaël van de Poppe posted on X that Solana’s lower-timeframe charts “actually do look good.” He said a breakout back into range, with $77 as the trigger level, could open a move toward $125-$130.
His comment adds another data point for traders watching whether retail momentum can carry SOL past resistance.
Network Usage Keeps Climbing
Separate from price action, Grayscale highlighted ongoing activity on the Solana network itself. The asset manager reported roughly 1,200 transactions per second and about 100 million daily transactions.
Grayscale also pointed to 4.3 million unique daily users and more than $100 million in transaction fees generated so far this year.
The firm named Raydium, Pump.fun, and GEODNET as examples of applications drawing users to the network.
Price action near $72.76 sits directly above a demand zone that has attracted buyers in past cycles, according to onchain analysis. That zone has held so far this week.
Traders are now watching whether SOL can build on current levels or whether it slips back toward earlier support marks in the days ahead.
The post Solana (SOL) Price: Can SOL Flip $100 as Network Activity Hits New Highs? appeared first on CoinCentral.


Ayrıca Şunları da Beğenebilirsiniz

Plume and FalconX Bring Institutional Lending On-Chain with RWA Credit Product

Crypto Investor: I Love XRP. I Was Thinking “$1,000, or $100s” Before This New Reality