

Will Bitcoin Price Regain $100K This Week As Bill Miller Signals Imminent Breakout Above ATH
The Bitcoin price edged up 1.3% over the past 24 hours to trade at $93,634 as of 1:03 a.m. EST, on trading volume that jumped 30% to $50.3 billion.
As BTC approaches the $94,000 resistance, Portfolio Manager Bill Miller IV says Bitcoin is set for new highs in 2026.
According to Miller, “Technicals are really starting to line up, and it looks like it’s ready to go again. I personally expect it to break out to a higher high than its all-time high from the fall.”
This comes as data from Santiment shows that whales and sharks (cohort holding between 10-10,000 BTC) have collectively accumulated 56,227 more BTC worth over $5.3 billion.
At the same time, retail traders have continued to take profits, creating bullish market conditions as long-term holders add to their hoards.
Can the price of Bitcoin continue to soar?
Bitcoin Price Breaks Out Of Key Support – Poised For A Continued Rally
The BTC price has now broken out above the 200-day SMA ($89,999), which has consistently acted as a barrier for the bulls since November 2025 and as a major demand area at the 0.786 Fibonacci Retracement level ($85,722).
After reaching an all-time high (ATH) of around $126,230 in October, Bitcoin then underwent a sustained correction, breaking key support levels within the Fibonacci Retracement chart.
However, the $85,722 level has acted as strong support, allowing BTC to surge past $90,000. This now puts the bulls on notice as they aim for a close above the 0.618 Fib level at $94,422, but they are still capped below the $100,533 psychological resistance.
The 50-day SMA remains above BTC at $104,021, indicating the price is still bearish in the short term but is being held up by the 200-day SMA, suggesting a bullish case in the long term.
Meanwhile, buyers now control the trend, with the Relative Strength Index (RSI) climbing towards the 50-midline level, currently at 48.21, up from 46 24 hours ago.
The Moving Average Convergence Divergence (MACD) also supports a bullish crossover, with the blue MACD line now crossing above the signal line. However, investors should exercise caution, as the MACD lines still trade below the neutral line on the 3-day timeframe.
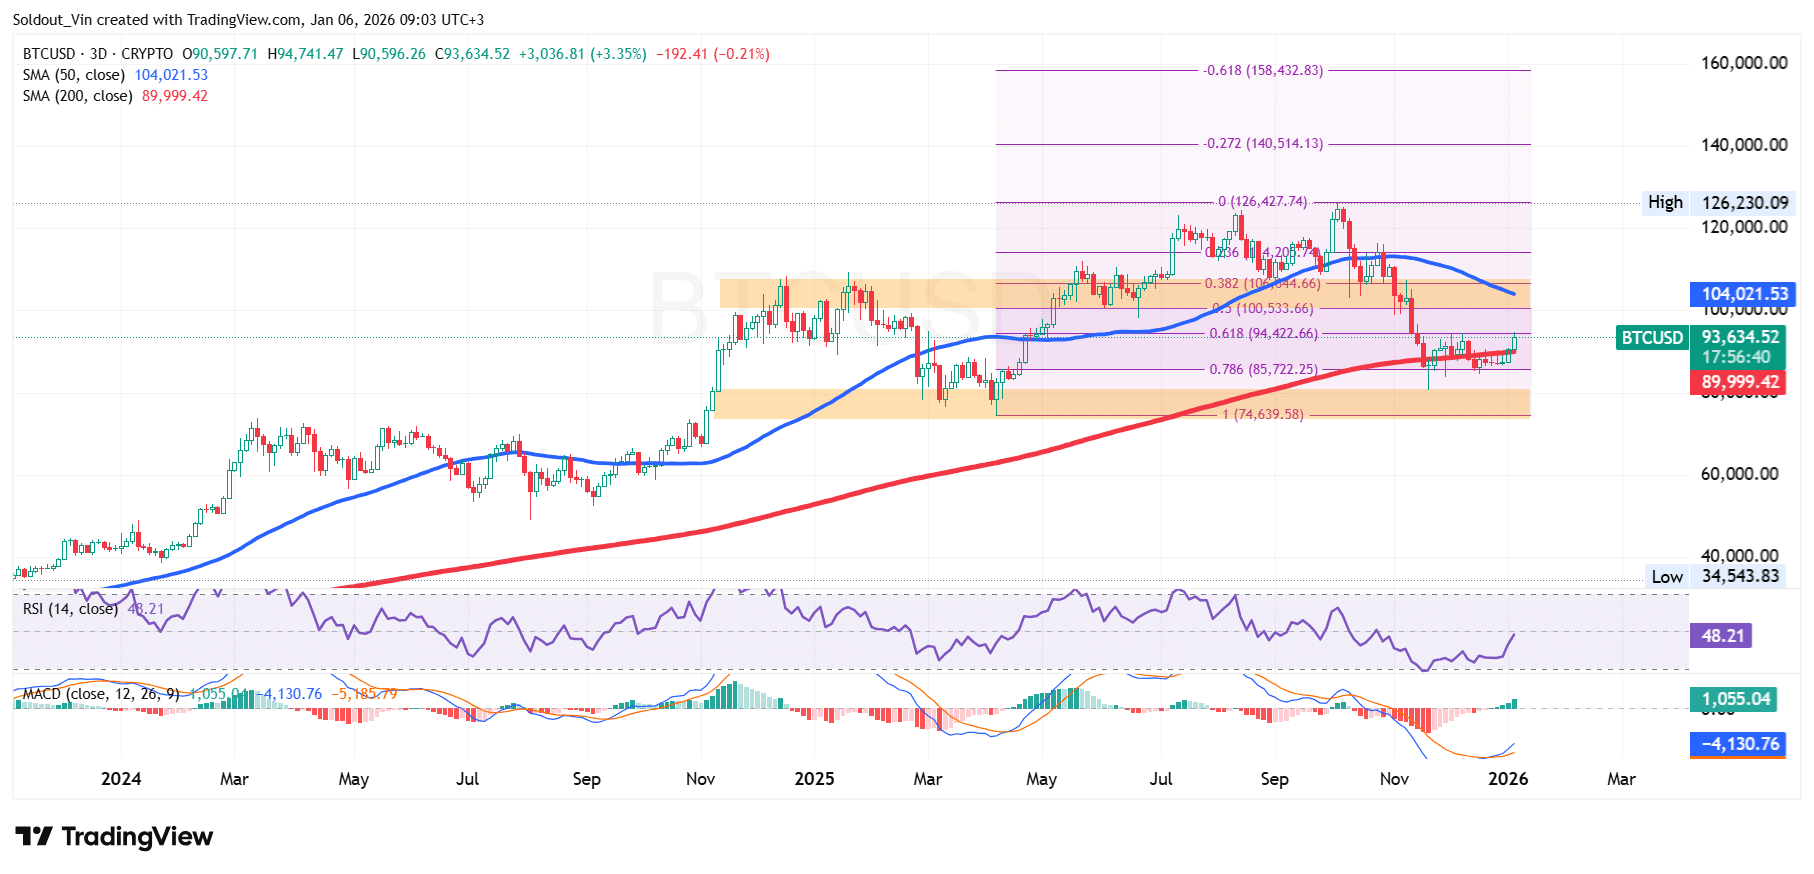 BTC/USD Chart Analysis Source: TradingView
BTC Price Outlook
According to the BTC/USD chart analysis, the BTC price is poised for a rally, provided it closes above the 0.618 Fib level at $94,422.
If this surge continues and bulls exert more pressure, the next key long-term resistance is $100,000, as Bill Miller predicts.
Further pressure could drive the Bitcoin price towards the 200-day SMA, as they target the key resistance area at the 0.236 Fib zone at $114,205, and the previous supply zone.
Conversely, if the price drops to continue consolidating within the $85,000 range, bears have an opportunity to act on it. Furthermore, following the recent surge from this support area, sellers may still trade in their gains, exerting bearish pressure.
If a drop occurs here, the next support area is the April support around $74,639.
Related News:
Ayrıca Şunları da Beğenebilirsiniz

Solana Price Outlook: Long-Term Bull Flags Clash With Short-Term Risk

TrendX Taps Trusta AI to Develop Safer and Smarter Web3 Network
