The analyst identified that MYRO has built a double bottom pattern, an indicator of a potential reversal of the current downtrend, which marks a new uptrend.The analyst identified that MYRO has built a double bottom pattern, an indicator of a potential reversal of the current downtrend, which marks a new uptrend.

MYRO Tests $0.005087 Support After Double Bottom Forms, Hinting at a Looming Breakout from Downtrend

2026/01/21 22:10
Okuma süresi: 3 dk
Bu içerikle ilgili geri bildirim veya endişeleriniz için lütfen crypto.news@mexc.com üzerinden bizimle iletişime geçin.
trading-chart

Prominent crypto analyst Sangita today identified a looming double bottom pattern in Myro (MYRO), a formation that suggests a substantial price momentum could be coming. The MYRO token, a meme coin based on the Solana blockchain, has been experiencing market difficulties recently. According to metrics from CoinGecko, MYRO price has been down 32.6% and 6,8% over the past week and month, respectively, showing its downside movement. Also, today the virtual asset recorded a 1.6% decline, currently making its price stand at $0.005087.

The Double Bottom Indicator and What It Means

Currently, Myro’s year price is down by 88.2%. As a result, it has significantly underperformed compared to Dogecoin and other major meme coins like Shiba Inu, MemeCore, PEPE, and others this cycle, raising concerns among investors. One of the main catalysts behind this underperformance is the lack of user interest surrounding overall meme coins over the past year, with MYRO one of the casualties that suffered the most.

The meme coin sector saw significant decreases in 2025 as volatility and macroeconomic concerns caused retail investors to shift away from highly speculative assets. Just to show an indicator of this decline, as of December 19, 2025, the overall market cap of meme coins dropped to $35 billion (the lowest point of the year), representing a 65% fall from the year’s high record. This is a sharp difference compared to the trading pattern noticed during the previous year. On Christmas Day 2024, the market cap of meme assets had reached $100 billion.

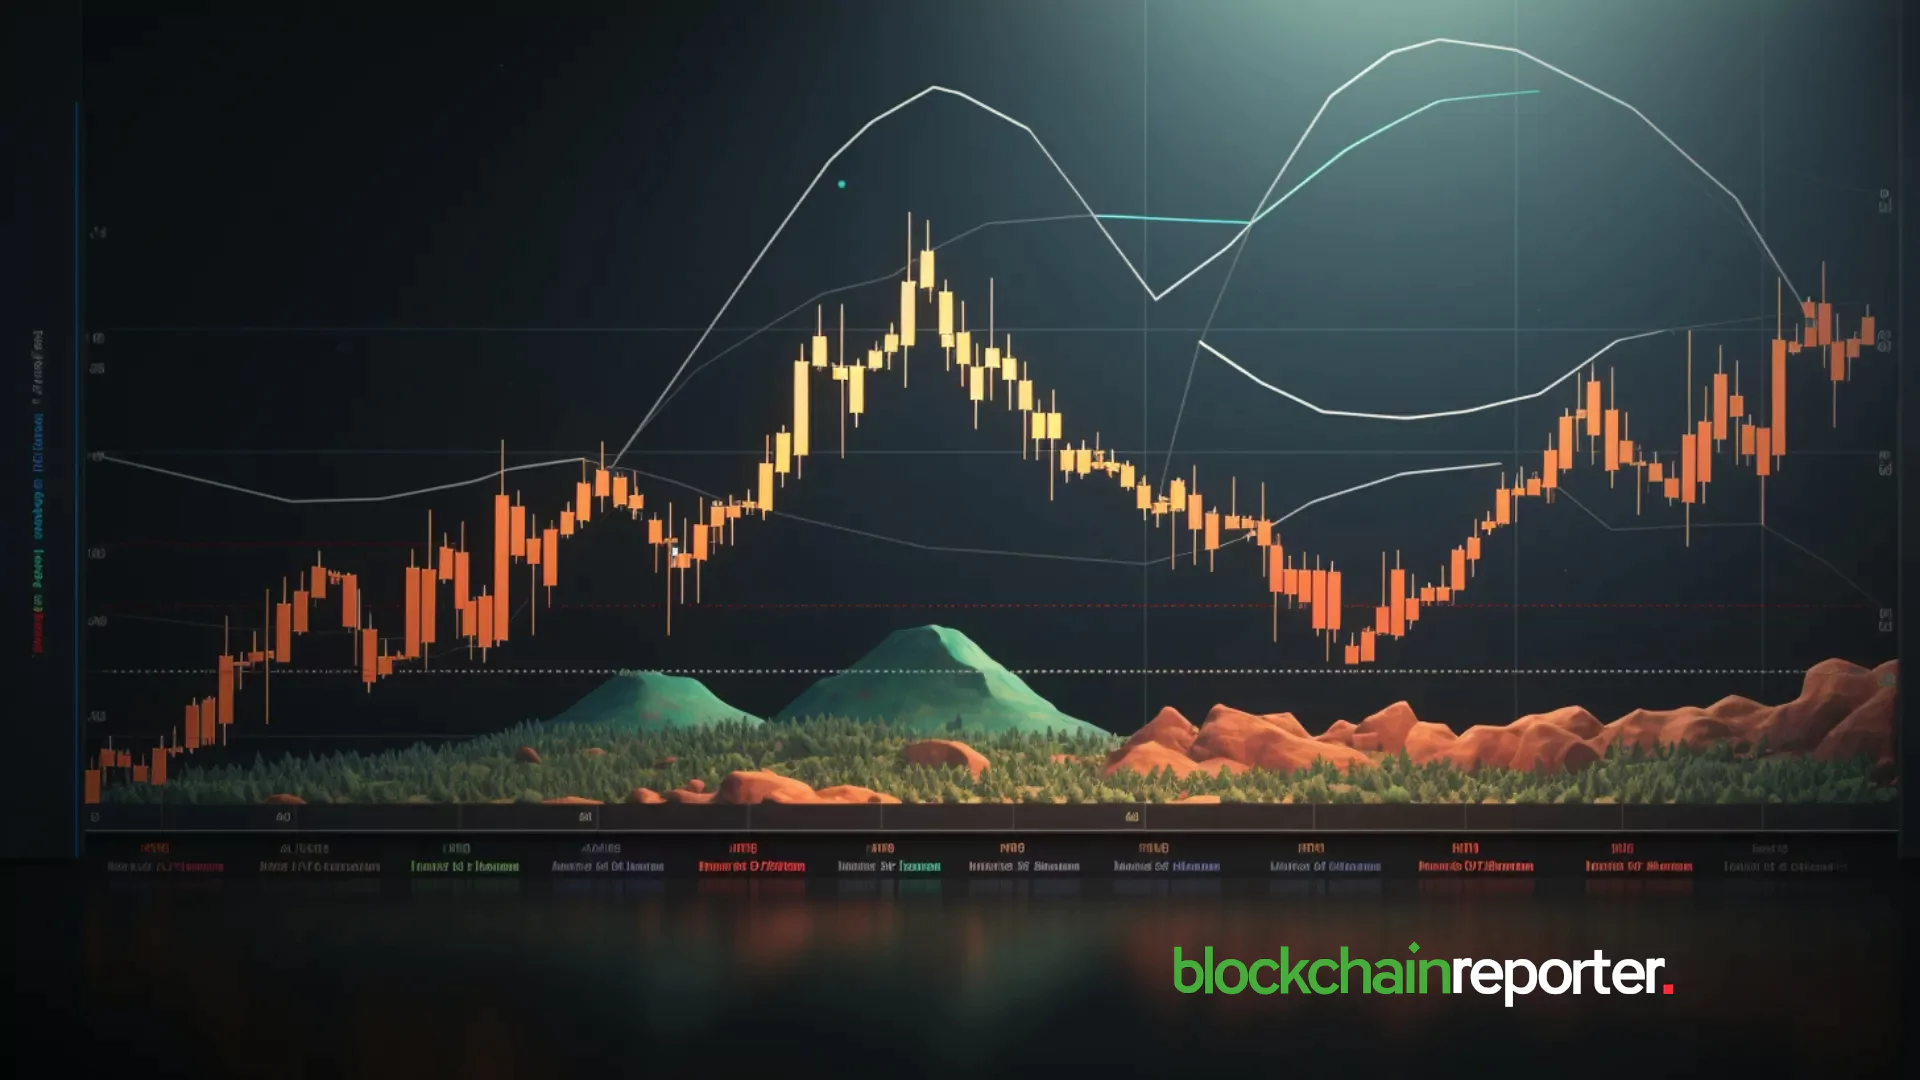
In a significant development for crypto markets, the MYRO weekly timeframe now displays a strong double bottom pattern, indicating that the asset is primed to experience potential major market rebounds toward higher resistance levels soon.

Crypto market participants typically consider meme assets as a thermometer (an indicator) of retail risk appetite. The substantial decrease in market cap noted in 2025 signified a more cautious environment in the crypto market during that year due to macro-economic uncertainties like trade tariff concerns witnessed in April, June, and October. This uncertainty adversely affected market sentiment last year.

Today, a top market analyst popularly known as Sangita shared his views on MYRO’s next move, suggesting that a rebound could happen if some technical levels hold. The analyst identified that MYRO appears to be creating a double bottom pattern. The double bottom pattern functions as a bullish reversal signal, showing that the ongoing downtrend is coming to an end, paving the way for an upcoming price trajectory.

MYROUSDThe current prince of Myro is $0.005087.

Analysis Of Factors Behind MYRO’s Looming Surge

The formation of the double bottom pattern on the MYRO trading chart signals an approaching bullish trend, driven by growing token accumulation and building positive market sentiment among crypto users. This shows that retail investors are gradually accumulating MYRO while institutional investors are also adding the token to their portfolios.

The rising buying activity (as identified by the analyst) is set to bolster MYRO prices and enable the token to embark on upcoming sustained upsides. One of the drivers behind this momentum is the growing user appetite for meme coins’ trading since the beginning of the new year. 

Piyasa Fırsatı
Myro Logosu
Myro Fiyatı(MYRO)
$0,002994
$0,002994$0,002994
+%2,28
USD
Myro (MYRO) Canlı Fiyat Grafiği
Sorumluluk Reddi: Bu sitede yeniden yayınlanan makaleler, halka açık platformlardan alınmıştır ve yalnızca bilgilendirme amaçlıdır. MEXC'nin görüşlerini yansıtmayabilir. Tüm hakları telif sahiplerine aittir. Herhangi bir içeriğin üçüncü taraf haklarını ihlal ettiğini düşünüyorsanız, kaldırılması için lütfen crypto.news@mexc.com ile iletişime geçin. MEXC, içeriğin doğruluğu, eksiksizliği veya güncelliği konusunda hiçbir garanti vermez ve sağlanan bilgilere dayalı olarak alınan herhangi bir eylemden sorumlu değildir. İçerik, finansal, yasal veya diğer profesyonel tavsiye niteliğinde değildir ve MEXC tarafından bir tavsiye veya onay olarak değerlendirilmemelidir.

Ayrıca Şunları da Beğenebilirsiniz

Troubling signs in new Trump intel report alarm expert: 'Raises real questions'

Troubling signs in new Trump intel report alarm expert: 'Raises real questions'

A new intelligence report on Iran's military capabilities alarmed an expert during a CNN interview. CNN reported, citing sources inside the Trump administration
Paylaş
Rawstory2026/04/03 10:22
Top Analyst Uses Hydraulic Pipe Analogy to Project XRP Rally from Bitcoin Capital Rotation

Top Analyst Uses Hydraulic Pipe Analogy to Project XRP Rally from Bitcoin Capital Rotation

The post Top Analyst Uses Hydraulic Pipe Analogy to Project XRP Rally from Bitcoin Capital Rotation appeared on BitcoinEthereumNews.com. Marketing analyst compares Bitcoin to wide pipe and XRP to narrow pipe system Theory suggests 5% Bitcoin capital rotation could generate $115 billion XRP inflow Projected targets range from $6-15 for slow flows to $15-60 for rapid movements Marketing research analyst Dr. Jim Willie has presented a hydraulic pipe analogy to explain how capital flowing from Bitcoin into XRP could trigger explosive price movements. During an appearance on Black Swan Capitalist with host Versan Aljarrah, Willie used physics principles to illustrate potential market dynamics between the two cryptocurrencies. Willie compared Bitcoin’s large market capitalization to a wide hydraulic pipe and XRP’s smaller market to a much narrower tube. His theory suggests that when pressure transfers from larger to smaller pipes, force increases substantially because area scales with the square of radius measurements. Market Cap Ratios Drive Theoretical Price Impact The analyst established a framework where Bitcoin’s market capitalization equals approximately 13 times XRP’s valuation, creating a mathematical basis for his projections. Under this model, identical capital flows that barely affect Bitcoin’s price could generate 13 times greater impact on XRP due to liquidity depth differences. Willie noted that real trading environments create non-linear effects as order books thin during large transactions, spreads widen, and liquidity providers withdraw. In smaller markets like XRP, price movements can follow quadratic rather than linear patterns, potentially amplifying the 13-fold liquidity gap into price swings tens or hundreds of times more extreme than Bitcoin. The analyst outlined different scenarios based on rotation speed. Slow transitions over weeks would allow market makers time to adjust, potentially driving XRP 2-5x higher while Bitcoin declines orderly. Daily timeframes could produce 5-20x XRP gains with sharper Bitcoin drops, while hourly rotations might create vertical XRP spikes of 10-20x before rapid corrections. Willie identified several amplifying factors including XRP’s limited…
Paylaş
BitcoinEthereumNews2025/09/23 06:20
Globalstar (GSAT) Stock Surges 15% on Amazon Acquisition Report

Globalstar (GSAT) Stock Surges 15% on Amazon Acquisition Report

TLDR Globalstar stock jumped more than 15% in after-hours trading following a Financial Times report that Amazon is in talks to acquire the satellite communications
Paylaş
Coincentral2026/04/02 19:49

Trade GOLD, Share 1,000,000 USDT

Trade GOLD, Share 1,000,000 USDTTrade GOLD, Share 1,000,000 USDT

0 fees, up to 1,000x leverage, deep liquidity