Litecoin (LTC) Accumulation Zone Around $45–$47 Could Push Price to $102
Litecoin (LTC) is stabilizing above the $45–$47 support range today as Bitcoin rebounds from $60,000, signaling potential short-term upward momentum. Over the past week, LTC has dipped 10.74%, but experts say this support zone may act as a strategic accumulation area for traders.
Source: CoinMarketCap
As of Saturday, February 7, LTC is trading at $54.42, with a 24-hour trading volume of $514.44 million and a market capitalization of $4.15 billion, according to CoinMarketCap.
Technical indicators like MACD and Bollinger Bands suggest improving momentum, though resistance near $55–$57 could limit immediate gains.
Also Read: Litecoin (LTC) Eyes $64 Breakout as Market Volatility Fuels Altcoin Momentum
Litecoin (LTC) Accumulation Signals Potential Recovery
According to crypto analyst Surf, LTC is currently holding above the critical $45–$47 support, aligning with the 0.786 Fibonacci retracement.
Surf highlights this area as a strong demand zone where long-term investors may begin accumulating, potentially setting the stage for a renewed bullish trend.
Source: Surf X Post
The price range between $45 and $55 has witnessed considerable selling pressure. If the buying interest for LTC increases, the token may rise to the $55-$57 region and may even rise to $73 in the future.
In the future, if the existing momentum persists, LTC may touch the $102 mark; however, this can only happen based on prevailing market conditions.
Technical Indicators Show Improving Momentum
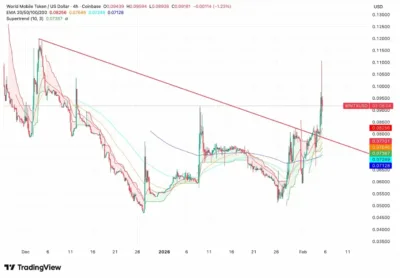
Litecoin (LTC) is trying to bounce back after a significant decline. Its price has dropped significantly, from as high as $63 to as low as $46.
Currently, the price is resting on the 20-period simple moving average of the Bollinger Bands. It faces mild resistance at $54.9. However, the dynamic support at $49.1 is also indicative of accumulation. Additionally, the upper Bollinger Band is at $60.7.
Source: TradingView
The MACD line has crossed above the signal line as it moves from the negative zone to a neutral zone. The size of the histogram is still relatively low.
Traders should monitor the resistance zone at $55–$57 and wait for a signal from the MACD line. Buying force needs to be high enough to challenge the overall downtrend.
Also Read: Litecoin (LTC) Faces Critical Support; Rebound Could Push Price to $80–$135
Ayrıca Şunları da Beğenebilirsiniz

Spanish man allegedly committed sex crimes in exchange for crypto

What Are the Penalties or Consequences of Not Having an EPR Authorization Certificate from CPCB?