

Bitcoin price confirms bullish divergence as liquidations spike, eyes $71k resistance
Bitcoin price has confirmed a bullish divergence on the daily chart as liquidation levels shot up on Monday.
- Bitcoin’s Relative Strength Index has formed a bullish divergence.
- Several key economic data points, including FOMC minutes from January, could decide Bitcoin’s trajectory this week.
- Over $75 million of positions were liquidated from Bitcoin’s futures market.
The daily chart for Bitcoin shows that its Relative Strength Index has formed a bullish divergence with its price, which has been in a prolonged downtrend since mid-January.
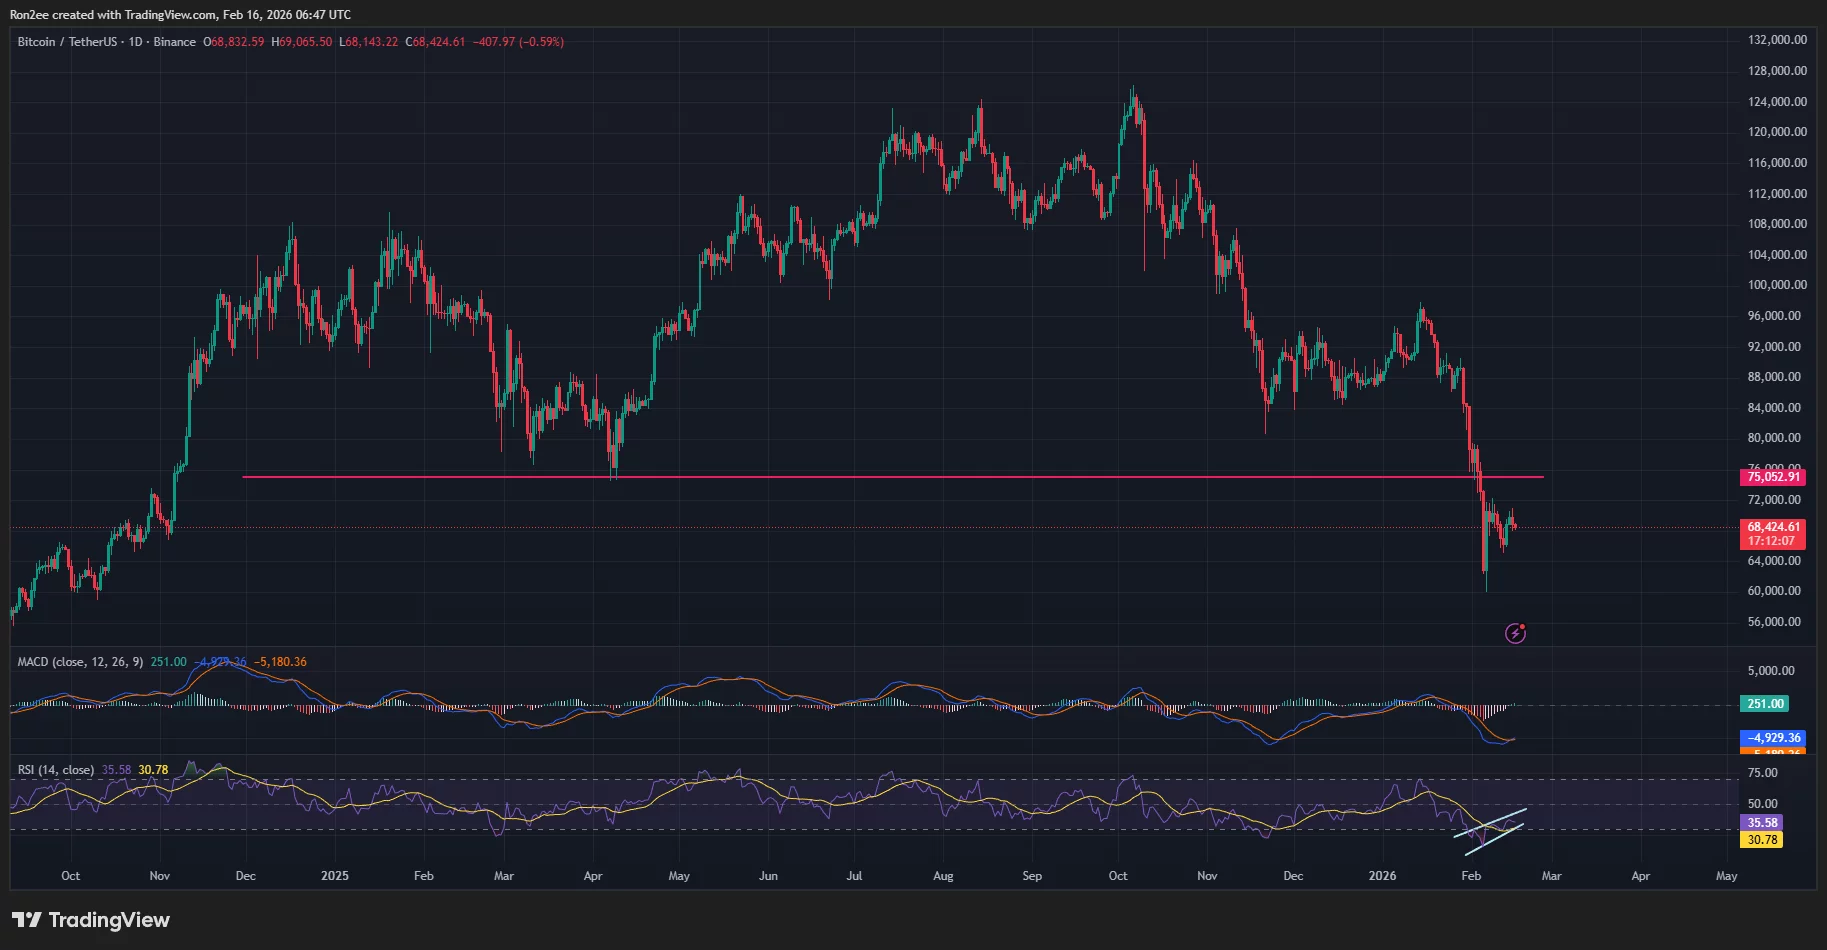
A bullish RSI divergence occurs when the RSI records higher lows while the related asset’s price continues to set lower lows. Such a technical formation has often been a precursor to a significant trend reversal or a relief rally.
Besides the bullish RSI, another positive indicator came from the MACD histogram and moving averages, which showed the MACD line had just crossed over the signal line, a telltale sign of an incoming bullish trend. Together, these indicators suggest that bullish momentum seems to be building, with bulls starting to assert dominance over the market.
Bitcoin bulls brace for a pivotal week
The shift comes after Bitcoin bulls attempted a rebound after the bellwether fell near the $65k support zone on Thursday. The asset rose sharply over the following days but faced resistance around $71k for the second time in the past 7 days, as investors remained on the sidelines awaiting key economic data expected to be released this week.
First, Federal Reserve Governor Michael S. Barr’s speech on Wednesday, Feb. 18, is expected to focus on the intersection of Artificial Intelligence and the labor market. On the same day, the Federal Reserve will release the minutes from its January meeting, offering further clarity on the central bank’s stance on monetary policy. Finally, on Friday, the U.S. will release Q4 GDP and core PCE inflation data, which will also act as a major market catalyst.
Upcoming macro data should illuminate the Fed’s stance on monetary easing for the remainder of 2026, offering the structural clarity necessary for Bitcoin to establish its next trend.
Key levels to watch
For now, the path of least resistance for Bitcoin (BTC) appears to be higher, with the $71K resistance line acting as the next key resistance level that traders will keep an eye on this week.
A decisive break above it could lead to a reclaim of $75,000, which has previously served as a key support area in past cycles. On the contrary, a drop under $65,000 could validate the downtrend towards a likely retrenchment towards the $60K low observed on Feb. 6.
In the meantime, massive liquidations have been sweeping through the broader crypto market. In the past 24 hours alone, the crypto market saw nearly $300 million liquidated, with Bitcoin alone accounting for over $75 million worth of positions being liquidated. Persistent liquidations may keep Bitcoin price under pressure throughout the upcoming sessions.
Disclosure: This article does not represent investment advice. The content and materials featured on this page are for educational purposes only.
Ayrıca Şunları da Beğenebilirsiniz

MetaPlanet Bitcoin Strategy Defies $654M Loss with Bold 2025 Acquisition Plans

LayerZero, RAIN drive $321M token unlocks this week
