

Top Analyst Reveals Bitcoin (BTC) Roadmap and Key Price Levels For the Next 2 Years
Bitcoin has declined greatly after reaching a new all-time high of $126,000 in 2025. Since then, the price has been reacting to negative economic developments and trading mostly between $60,000 and $74,000 during the past 2 months.
Current market action shows BTC holding near $70,000 as buyers continue defending that range despite repeated pressure from sellers.
Crypto analyst Crypto Patel believes the recent pullback may already be revealing a larger roadmap for Bitcoin price over the next several years.
Crypto Patel shared a weekly chart analysis that maps out possible accumulation zones and long-term price targets for BTC. His view focuses on market structure, Fibonacci retracement levels, and a key resistance barrier that bulls must eventually overcome.
Bitcoin Price Breakdown After $126,000 Peak Shows A Classic Market Structure Reset
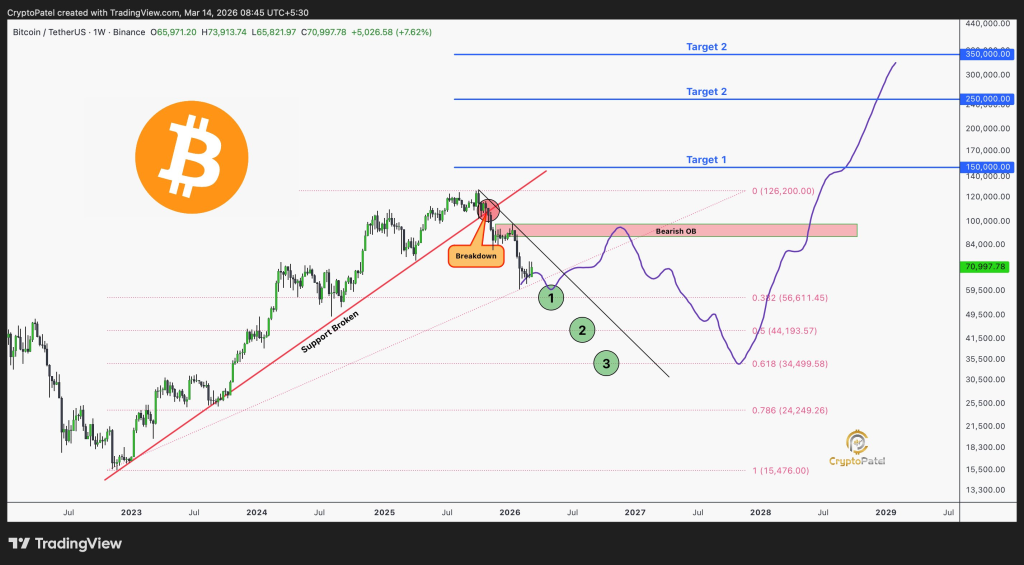
Crypto Patel explains that the chart began to change after Bitcoin failed to maintain its upward trend line following the $126,000 peak. The image shows a clear trend support that carried BTC through most of the 2023 to 2025 bull cycle.
That support line eventually broke when price pulled back from the all time high. The breakdown marked a turning point in the structure.
Price then moved lower into what the chart labels as a breakdown phase. That move pushed BTC toward the mid $60,000 range before finding temporary stability.
Crypto Patel notes that such resets often occur after major cycle tops because leverage and speculative demand need time to cool down before the next expansion phase begins.
 Source: @CryptoPatel / X
Market structure now shows Bitcoin trading below a key resistance zone between $90,000 and $95,000. The chart labels this region as a bearish order block. Crypto Patel explains that this zone represents the last area where strong selling pressure appeared before the deeper correction began. Bulls would need to reclaim that region before any attempt toward new highs becomes realistic.
Fibonacci Levels On The Bitcoin Chart Reveal Possible Accumulation Zones
Crypto Patel identifies several Fibonacci retracement levels that could act as accumulation zones during the current correction. The first level sits near $56,611, which aligns with the 0.382 Fibonacci retracement on the chart. That zone appears as the first possible support area if the current consolidation weakens.
The next potential accumulation area sits near $44,193. This level represents the midpoint retracement of the previous major rally. Crypto Patel describes that region as a stronger demand zone because previous cycles often paused around the 0.5 retracement before the next expansion phase started.
Read Also: Chinese DeepSeek AI Predicts the Price of XRP and Pi Coin if the U.S. and Iran Agree to a Ceasefire
The final and deepest level on the chart appears around $34,499. This area corresponds with the 0.618 Fibonacci retracement. Crypto Patel explains that many historic Bitcoin cycle bottoms formed near this level because long term investors tend to step in aggressively at that stage of a correction.
Those three zones create a layered support structure beneath the current BTC price. Market behavior during the next several months could determine which zone ultimately becomes the cycle floor.
Long Term Bitcoin Price Targets Extend Toward $350,000 If Structure Holds
Crypto Patel also outlines three long term targets that could define the next bull cycle if Bitcoin eventually recovers from the current correction. The first target appears near $150,000. This level represents a modest extension beyond the previous all time high.
The second target stands close to $250,000. The chart places that level at a major extension zone where earlier cycles also reached exhaustion phases.
Read Also: The Math Behind XRP Price Hitting $1,000+: Analyst Breaks Down the Numbers
The most aggressive projection on the chart shows a potential move toward $350,000 later in the cycle. Crypto Patel explains that such projections come from Fibonacci extensions and historical Bitcoin cycle behavior. The purple curve drawn on the chart visualizes how a multi year recovery could unfold after the correction phase ends.
Bitcoin price therefore appears to be sitting inside a larger cycle reset rather than a finished trend. Support zones below and resistance levels above now define the roadmap that Crypto Patel believes the market could follow.
Subscribe to our YouTube channel for daily crypto updates, market insights, and expert analysis.
The post Top Analyst Reveals Bitcoin (BTC) Roadmap and Key Price Levels For the Next 2 Years appeared first on CaptainAltcoin.
Ayrıca Şunları da Beğenebilirsiniz

When Housing Slows, Furniture Retail Feels It First

XRP to $21.5? Data Analyst Says Real Phase 4 Rally Will Begin Once This Happens
