


Understanding the Key Factors Influencing the Price of UniBot (UNIBOT)
The price of UniBot (UNIBOT) demonstrates significant volatility, characteristic of digital assets in the cryptocurrency market. As a Telegram-based trading bot token operating on Ethereum, UNIBOT's price is shaped by a complex interplay of factors. From tokenomics and supply mechanisms to market sentiment and technical indicators, understanding these elements is essential for anyone navigating the often unpredictable crypto landscape. For both newcomers and experienced traders in the UniBot ecosystem, identifying and analyzing these UNIBOT price drivers provides essential context for investment decisions and helps distinguish between short-term price noise and genuine value signals. This comprehensive guide explores the major factors that drive UniBot's price movements, providing the analytical foundation needed to make more informed decisions in this innovative intersection of social trading and blockchain technology.
Market Fundamentals: Supply, Demand, and Tokenomics
- Supply and circulation dynamics: UniBot has a fixed total supply of 1,000,000 tokens, with the same amount as its maximum and total supply. The circulating supply is also 1,000,000, representing a 1% circulation rate at the time of reporting.
- Token burns: UniBot implements a 0.1% daily token burn rate, gradually reducing the circulating supply and introducing a deflationary element that can support long-term UNIBOT price appreciation.
- Demand factors and utility: Demand for UNIBOT is driven by its role as the primary utility token within the Unibot Telegram trading ecosystem. Token holders benefit from reduced platform fees, access to premium features (such as reserved nodes for faster transactions), and advanced trading tools like MEV protection and private transactions.
- Tokenomics structure: At launch, 100% of liquidity was added, and the token's distribution is transparent, with no mention of private allocations or vesting schedules in available documentation.
This carefully managed supply environment, combined with real-world utility as a trading facilitator and fee-reduction mechanism, creates natural demand pressure that can positively impact the UniBot price. The deflationary burn and transparent tokenomics structure help maintain market confidence and liquidity.
Technical Indicators and Market Sentiment
- Key technical analysis metrics: Traders monitor support and resistance levels, moving averages, and volume indicators to identify potential reversal or continuation patterns in UNIBOT's price action.
- Price charts and patterns: Historical price data from MEXC shows significant UNIBOT price volatility, with all-time highs above $236 and recent prices ranging from $2.02 to $3.24.
- Social media sentiment and community growth: As a social trading tool, UniBot's price is highly sensitive to community sentiment and activity on platforms like Telegram and X (Twitter). Increased engagement and positive discourse often precede UNIBOT price rallies.
- Market psychology: Fear and greed cycles can amplify price swings, with periods of market-wide enthusiasm leading to accelerated growth, while downturns may trigger disproportionate selling despite unchanged fundamentals.
Understanding these technical and psychological dynamics helps investors distinguish between temporary sentiment-driven swings and genuine shifts in UniBot's value proposition.
External Catalysts and Market Developments
- Major partnerships and technological milestones: Announcements of new features, integrations, or partnerships with data providers and crypto projects can create immediate positive UNIBOT price pressure and sustain long-term support.
- Industry trends and competitive positioning: UniBot's value is influenced by its standing among Telegram trading bots and the broader demand for automated trading solutions in crypto.
- Macroeconomic influences and regulatory developments: Broader trends such as inflation, interest rates, and crypto regulations in major markets can impact investment flows into assets like UNIBOT.
- Integration announcements and enterprise adoption: Each new integration or enterprise adoption can expand UniBot's user base and utility, supporting UNIBOT price appreciation.
On-Chain Metrics and Network Activity
- Blockchain transaction volumes and wallet growth: On-chain analytics, such as transaction volume and wallet address growth, provide insight into UniBot's adoption and user engagement.
- Active addresses and network usage: Increases in daily active addresses often precede positive UNIBOT price movements, while declines may signal waning interest.
- Smart contract interactions and developer activity: Frequent smart contract interactions and ongoing development activity (e.g., GitHub contributions) indicate a healthy ecosystem and can correlate with stronger long-term UNIBOT price performance.
- Staking statistics and network security: While UniBot does not currently feature staking, metrics such as token burn rates and liquidity levels offer alternative insights into holder confidence and market stability.
Conclusion
Successfully analyzing UniBot's price movements requires synthesizing multiple factors rather than relying on isolated metrics. By combining tokenomics fundamentals, technical indicators, market sentiment, and on-chain metrics, investors can build a holistic view of what truly drives UNIBOT's value. Understanding these UNIBOT price factors creates the foundation for effective trading strategies. To put this knowledge into action, our 'UniBot Trading Complete Guide' provides practical steps to implement these insights in real trading scenarios. Explore everything from setting up your first position to managing risk effectively, and start navigating the dynamic UniBot market with confidence today.
The articles shared on this page are sourced from public platforms and are provided for reference only. They do not represent the position or views of MEXC. All rights belong to MEXC. If you believe any content infringes upon the rights of a third party, please contact service@support.mexc.com for prompt removal. MEXC does not guarantee the accuracy, completeness, or timeliness of any content and is not responsible for any actions taken based on the information provided. The content does not constitute financial, legal, or other professional advice, nor should it be interpreted as a recommendation or endorsement by MEXC. For expert insights and in-depth analysis, visit MEXC Learn.
Latest Updates on NEAR
View More
SpaceX Options Surge: Turning IPO Momentum Into a Volatility Test
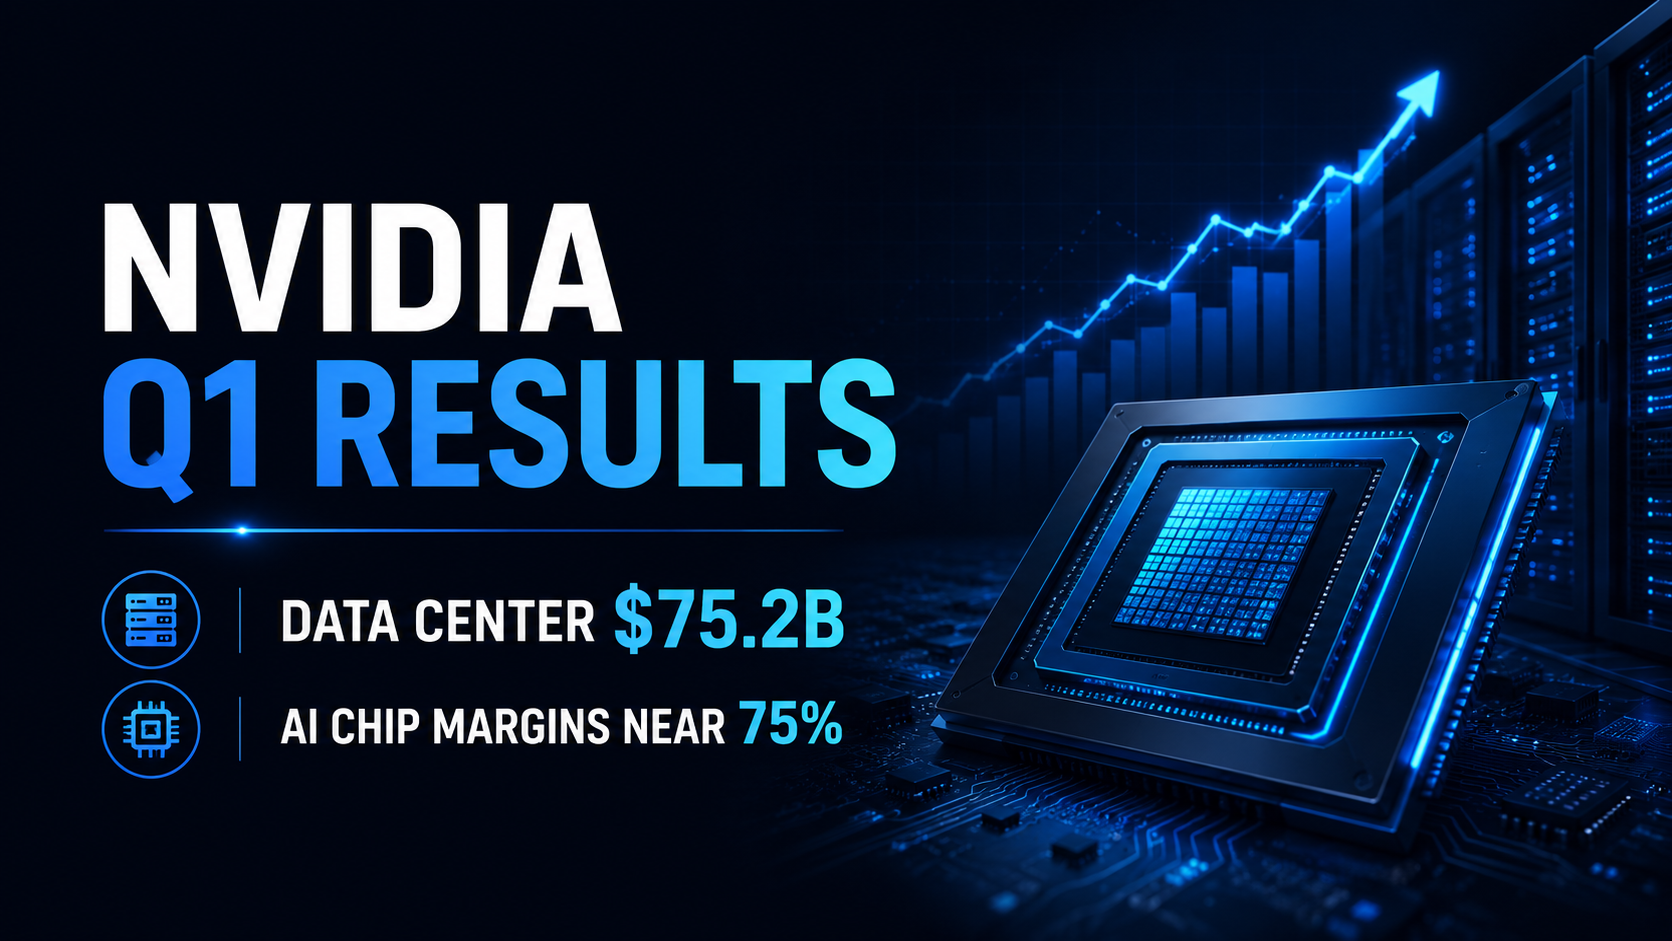
Nvidia FY2027 Q1 Earnings Review: Data Center Revenue Hits $75.2B as AI Chip Margins Hold Near 75%

Miden USDCx Brings Private Stablecoin Payments Onchain


HOT
Currently trending cryptocurrencies that are gaining significant market attention
Crypto Prices
The cryptocurrencies with the highest trading volume
Newly Added
Recently listed cryptocurrencies that are available for trading