

Chainlink (LINK) has been on a slide since hitting a yearly high of around $27.7 in August. A chart from Elliott Waves Academy, a crypto analysis page with over 12,000 followers on X, suggests the trend might not be over yet. On the 4-hour chart, the setup still looks bearish, with possible support showing upChainlink (LINK) has been on a slide since hitting a yearly high of around $27.7 in August. A chart from Elliott Waves Academy, a crypto analysis page with over 12,000 followers on X, suggests the trend might not be over yet. On the 4-hour chart, the setup still looks bearish, with possible support showing up
Chart Projects Further Dip for Chainlink (LINK) Price: How Bad Can It Get?
For feedback or concerns regarding this content, please contact us at crypto.news@mexc.com
Chainlink (LINK) has been on a slide since hitting a yearly high of around $27.7 in August. A chart from Elliott Waves Academy, a crypto analysis page with over 12,000 followers on X, suggests the trend might not be over yet. On the 4-hour chart, the setup still looks bearish, with possible support showing up


Disclaimer: The articles reposted on this site are sourced from public platforms and are provided for informational purposes only. They do not necessarily reflect the views of MEXC. All rights remain with the original authors. If you believe any content infringes on third-party rights, please contact crypto.news@mexc.com for removal. MEXC makes no guarantees regarding the accuracy, completeness, or timeliness of the content and is not responsible for any actions taken based on the information provided. The content does not constitute financial, legal, or other professional advice, nor should it be considered a recommendation or endorsement by MEXC.
You May Also Like

South Korean Gaming Company NXC Decides to Reduce Its Crypto Holdings! Here Are the Details
NXC, the parent company of Nexon, one of South Korea's leading gaming companies, is undergoing a significant restructuring of its crypto asset strategy. Continue
Share
Bitcoinsistemi2026/04/13 14:42
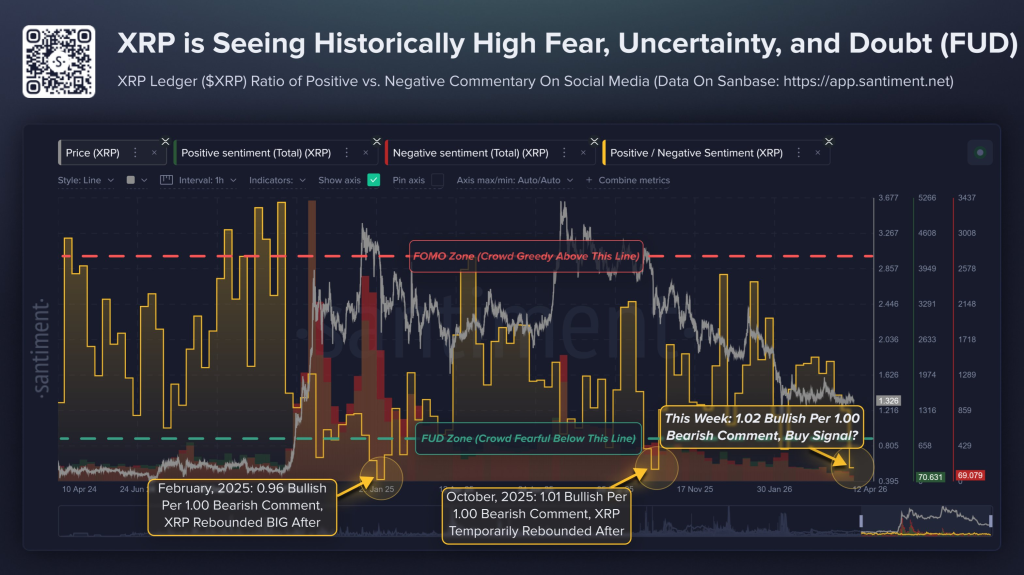
XRP Sentiment Just Flashed a Rare Contrarian Signal – Here’s What Happened the Last Two Times
XRP has dropped 63% over the past nine months, falling from above $3.50 to current levels near $1.30. Retail investors have finally turned their backs on the asset
Share
Captainaltcoin2026/04/13 14:01

Exclusive interview with Smokey The Bera, co-founder of Berachain: How the innovative PoL public chain solves the liquidity problem and may be launched in a few months
Recently, PANews interviewed Smokey The Bera, co-founder of Berachain, to unravel the background of the establishment of this anonymous project, Berachain's PoL mechanism, the latest developments, and answered widely concerned topics such as airdrop expectations and new opportunities in the DeFi field.
Share
PANews2024/07/03 13:00


