

Solana (SOL) Price: Can SOL Break $90 or Is Another Drop Coming?
TLDR
- Solana is trading around $80 with resistance near $87
- Short-term chart targets $88–$90 based on Fibonacci levels
- Long-term weekly chart keeps a $1,000 bull case in view
- SOL ETFs saw over $17 million in outflows this week
- Open interest declined to $4.72 billion, showing reduced trader activity
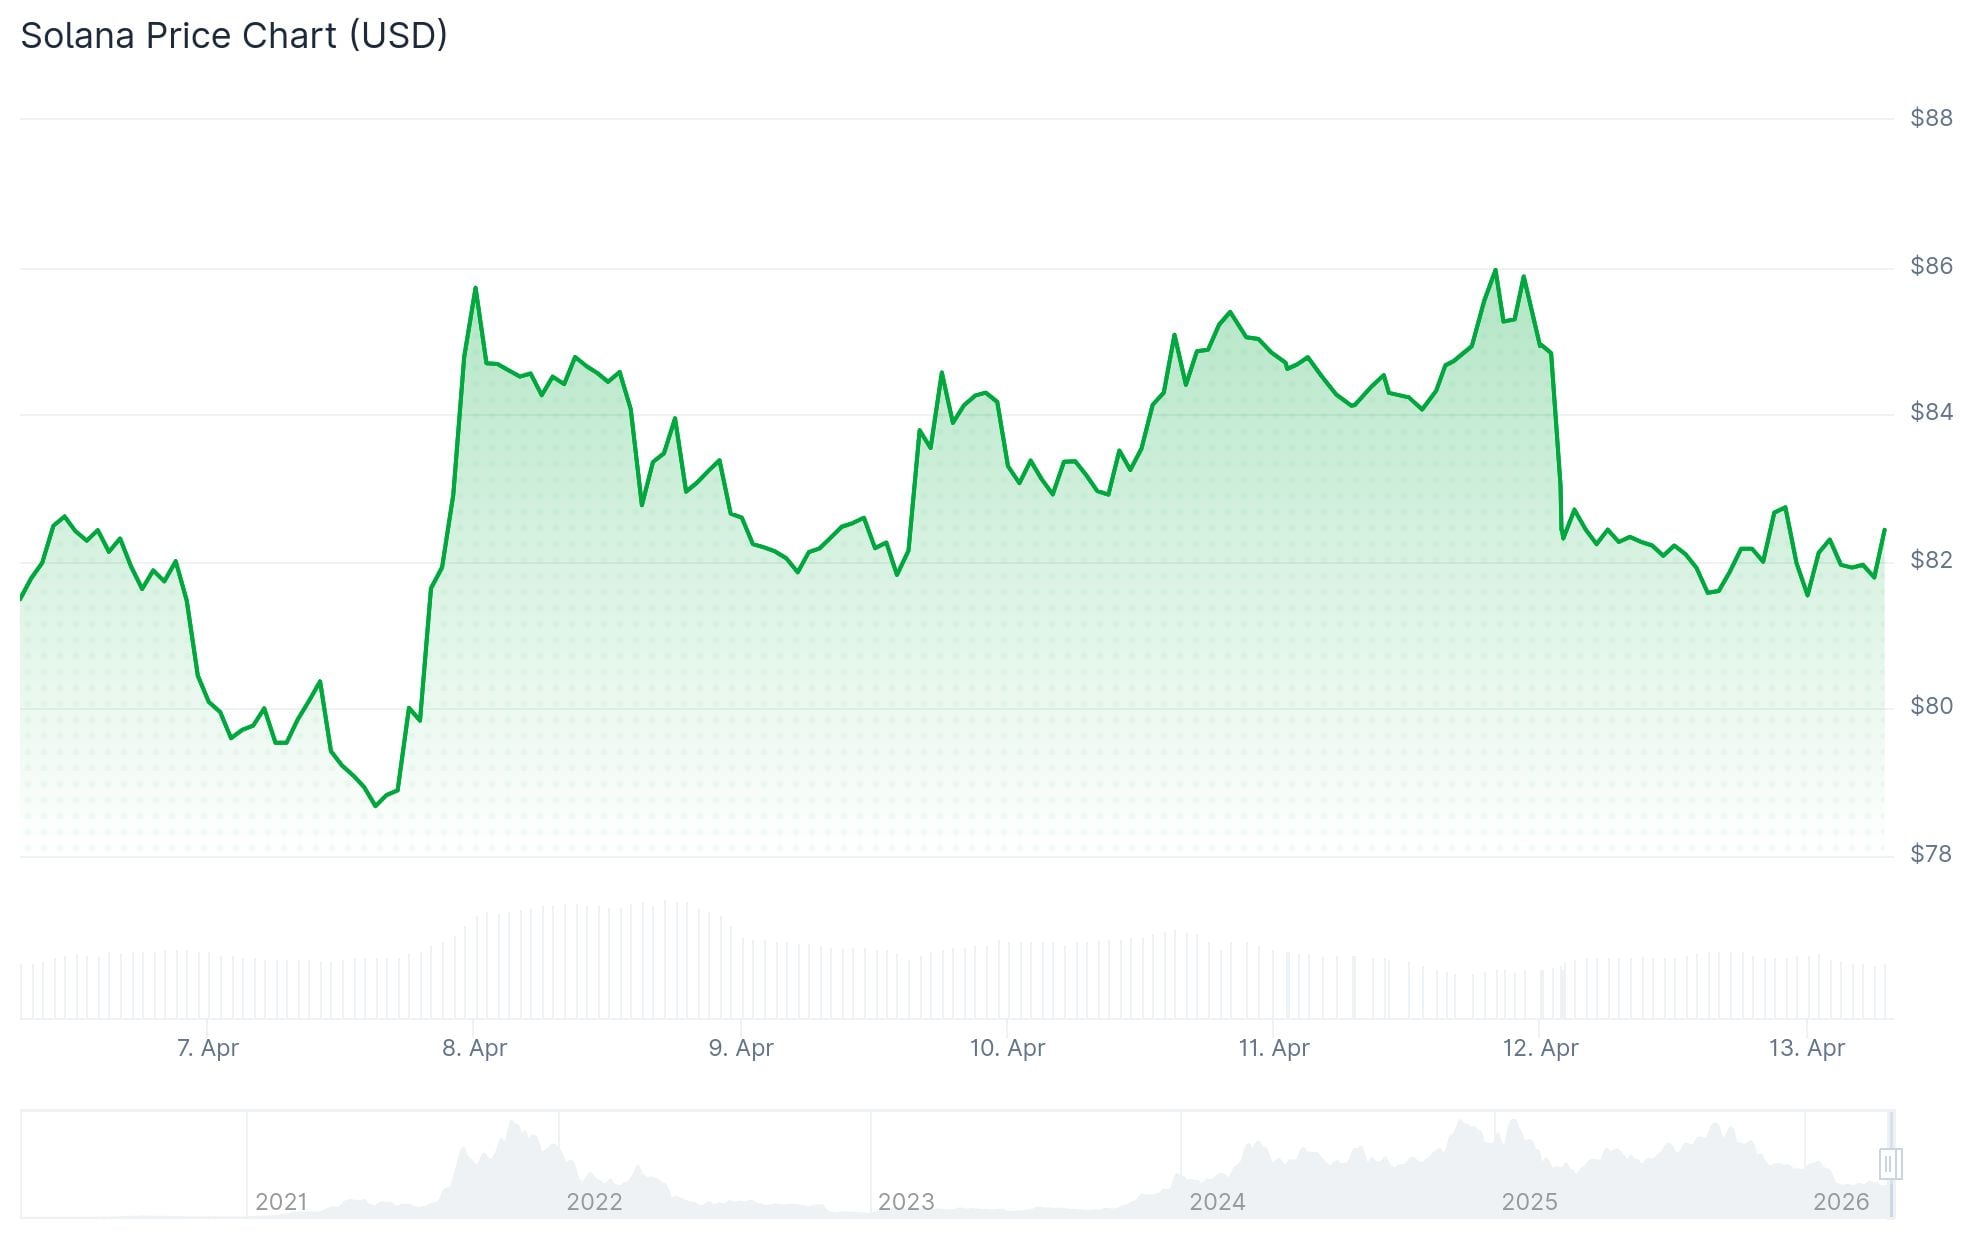
Solana is trading around $80 as of early this week, following a 4% drop on Sunday. The move lower came alongside a broader crypto market pullback. Price action has been range-bound, with buyers struggling to push past a key resistance zone.
 Solana (SOL) Price
The 50-day exponential moving average sits at $87.43, right near a descending trendline. This level has repeatedly stopped upward moves. The 100-day EMA is at $99.19 and the 200-day EMA at $118.32, both acting as further ceilings above.
On the short-term chart, analyst MCO Global maps a step-by-step recovery toward a Fibonacci target zone between $88.13 and $90.01. Both projected wave paths point to that same range, making it the next clear objective if the recovery continues.
Support below sits between $71.92 and $77.92. The February 5 low at $77.60 is the immediate floor. A break below that could open the way to $67.50.
ETF Outflows Add Pressure
Solana-focused ETFs recorded over $17 million in outflows this week. A sharp withdrawal earlier in the week drove most of that figure. On Friday, $11.45 million in inflows came in, trimming the weekly net outflow to $5.62 million.
 Source: SoSoValue
This marks the third straight week of net outflows from Solana ETFs. The data points to reduced institutional appetite for SOL exposure at current levels.
Open interest dropped to $4.72 billion on Monday, down from $4.88 billion the day before. Funding rates remain slightly positive, meaning long positions still hold a small edge over shorts.
The RSI sits below 50, reflecting weak buying momentum. The MACD line is below zero but showing early signs of softening downside pressure. No clear reversal signal has formed yet.
Long-Term Chart Keeps $1,000 in View
Analyst James Easton points to the weekly chart and argues the broader structure remains intact. In his view, Solana is still inside a wide upward channel and has not broken down from the larger pattern.
He places the extreme long-term bull target at $1,000, provided SOL avoids a deeper collapse and eventually regains momentum. The current weakness, in that reading, looks more like consolidation than failure.
The MACD on the weekly chart still looks soft, and the momentum has not turned up yet. That means the long-term case is still alive but depends on patience.
Solana’s most recent data shows price holding just above $80, with the $87–$90 range as the next zone traders are watching.
The post Solana (SOL) Price: Can SOL Break $90 or Is Another Drop Coming? appeared first on CoinCentral.


You May Also Like

Academic Publishing and Fairness: A Game-Theoretic Model of Peer-Review Bias

IMF Stablecoin Warning: Urgent Call for Reserve Reform to Prevent Catastrophic Bank Runs
![[Rappler’s Best] Unintended consequences](https://www.rappler.com/tachyon/2026/04/2026-04-12T014523Z_1199031946_RC2DNKAJDOHS_RTRMADP_3_IRAN-CRISIS-PAKISTAN-scaled.jpg?resize=75%2C75&crop_strategy=attention)


