

Ethereum’s Next Rally May Have Started: But No One Is Talking About It

The post Ethereum’s Next Rally May Have Started: But No One Is Talking About It appeared first on Coinpedia Fintech News
Ethereum (ETH) still appears range-bound on the chart, but the underlying data is starting to diverge in a meaningful way. Over the past week, more than 101,000 ETH has been accumulated, pushing large holdings close to 5 million ETH, while spot ETF inflows have now crossed $12 billion, with consistent capital entering the market. At the same time, Ethereum continues to hold firmly above the $2,300 level, showing sustained demand despite the absence of a breakout.
This kind of disconnect between price action and underlying flows rarely persists for long. When accumulation and institutional demand build while price remains compressed, it typically signals positioning ahead of expansion, not after it. If this divergence continues to develop, Ethereum’s next rally may not start with a visible trigger, it may already be forming beneath the surface.
Trend Structure Shifts as SuperTrend Flips Bullish
Ethereum’s broader trend structure has begun to turn, supported by a key technical signal. The SuperTrend indicator has flipped bullish on the daily timeframe for the first time in over a year, marking a shift in directional bias after a prolonged corrective phase. This transition is occurring while ETH is still trading below major resistance, which makes it structurally significant rather than reactive.
Such early trend reversals typically indicate that downside pressure has weakened and the market is entering a transition phase. When combined with stable price behavior, it often reflects the beginning of a new cycle rather than the end of the previous one.
Accumulation Expands as Large Holders Position Early
On-chain and treasury data show that accumulation is not only present but accelerating. BitMine added 101,627 ETH within a single week, pushing its total holdings to approximately 4.976 million ETH. This marks one of the largest accumulation phases recorded in recent months and reflects a clear increase in exposure from large players.
Accumulation is taking place while Ethereum remains within a defined range, rather than during a breakout. This indicates that buying is driven by positioning at current levels, not by momentum. Such behavior is typically associated with early-stage accumulation, where capital enters before broader market participation.
ETF Inflows Show Consistent Institutional Demand
Institutional flows are reinforcing the same trend observed in accumulation data. Ethereum spot ETFs have now recorded $12.01 billion in cumulative inflows, with recent sessions showing steady capital entry. On April 20 alone, inflows reached $67.77 million, continuing a sequence of positive net flows following earlier volatility.
Total net assets have climbed toward $13.7 billion, reflecting sustained allocation rather than short-term interest. The shift from mixed flows to consistent inflows suggests that institutions are gradually increasing exposure under stable market conditions. This type of demand typically supports longer-term price structure rather than short-lived movements.
Ethereum Price Analysis: Structure Builds After Sharp Reset
Ethereum’s recent price action reflects a clear shift from distribution to accumulation following a sharp downside reset. After failing near the $4,000–$4,500 resistance zone, ETH saw a strong breakdown that pushed price toward the $2,200–$2,000 region, where demand has now started to stabilize the structure.
Since the drop, ETH price has moved into a consolidation phase, holding above this base while forming a short-term range. However, during the consolidation, volume buildup indicates that participation is increasing even without a breakout. This type of behavior typically reflects absorption rather than selling pressure.
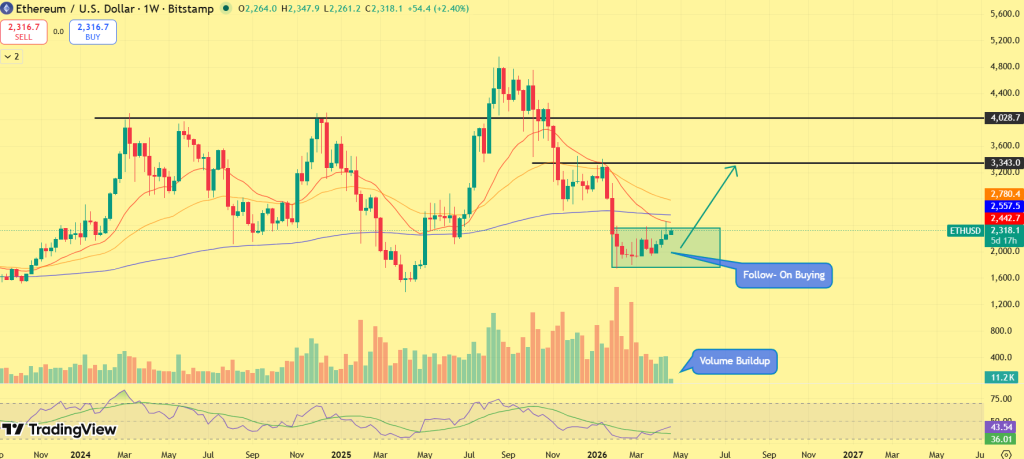
At the same time, the ETH/USDT price chart shows a developing “follow-on buying” zone, where higher lows are beginning to form after the initial rebound. This suggests that buyers are stepping in progressively, not aggressively, which is consistent with early-stage accumulation rather than late-stage momentum.
On the upside, the immediate level to watch sits near $2,800, which acts as a key resistance. A sustained move above this level would confirm strength and open the path toward $3,300, where the next supply zone is positioned. On the downside, the $2,200–$2,300 range remains critical. A breakdown below this zone would weaken the current structure and indicate that accumulation has not fully stabilized yet.
Overall, Ethereum is no longer in a corrective phase, but it has not transitioned into expansion either. The current structure reflects a base-building phase, where demand is gradually returning before any directional move unfolds.


You May Also Like

XRP Ledger Moves to Native Post-Quantum Security by 2028

Goldman Sachs Projects S&P 500 Rally to 7,600 Amid Historic Consumer Confidence Collapse


