

Solana (SOL) Revisits Critical Support Zone That Fueled Previous 2,200% Surge
TLDR
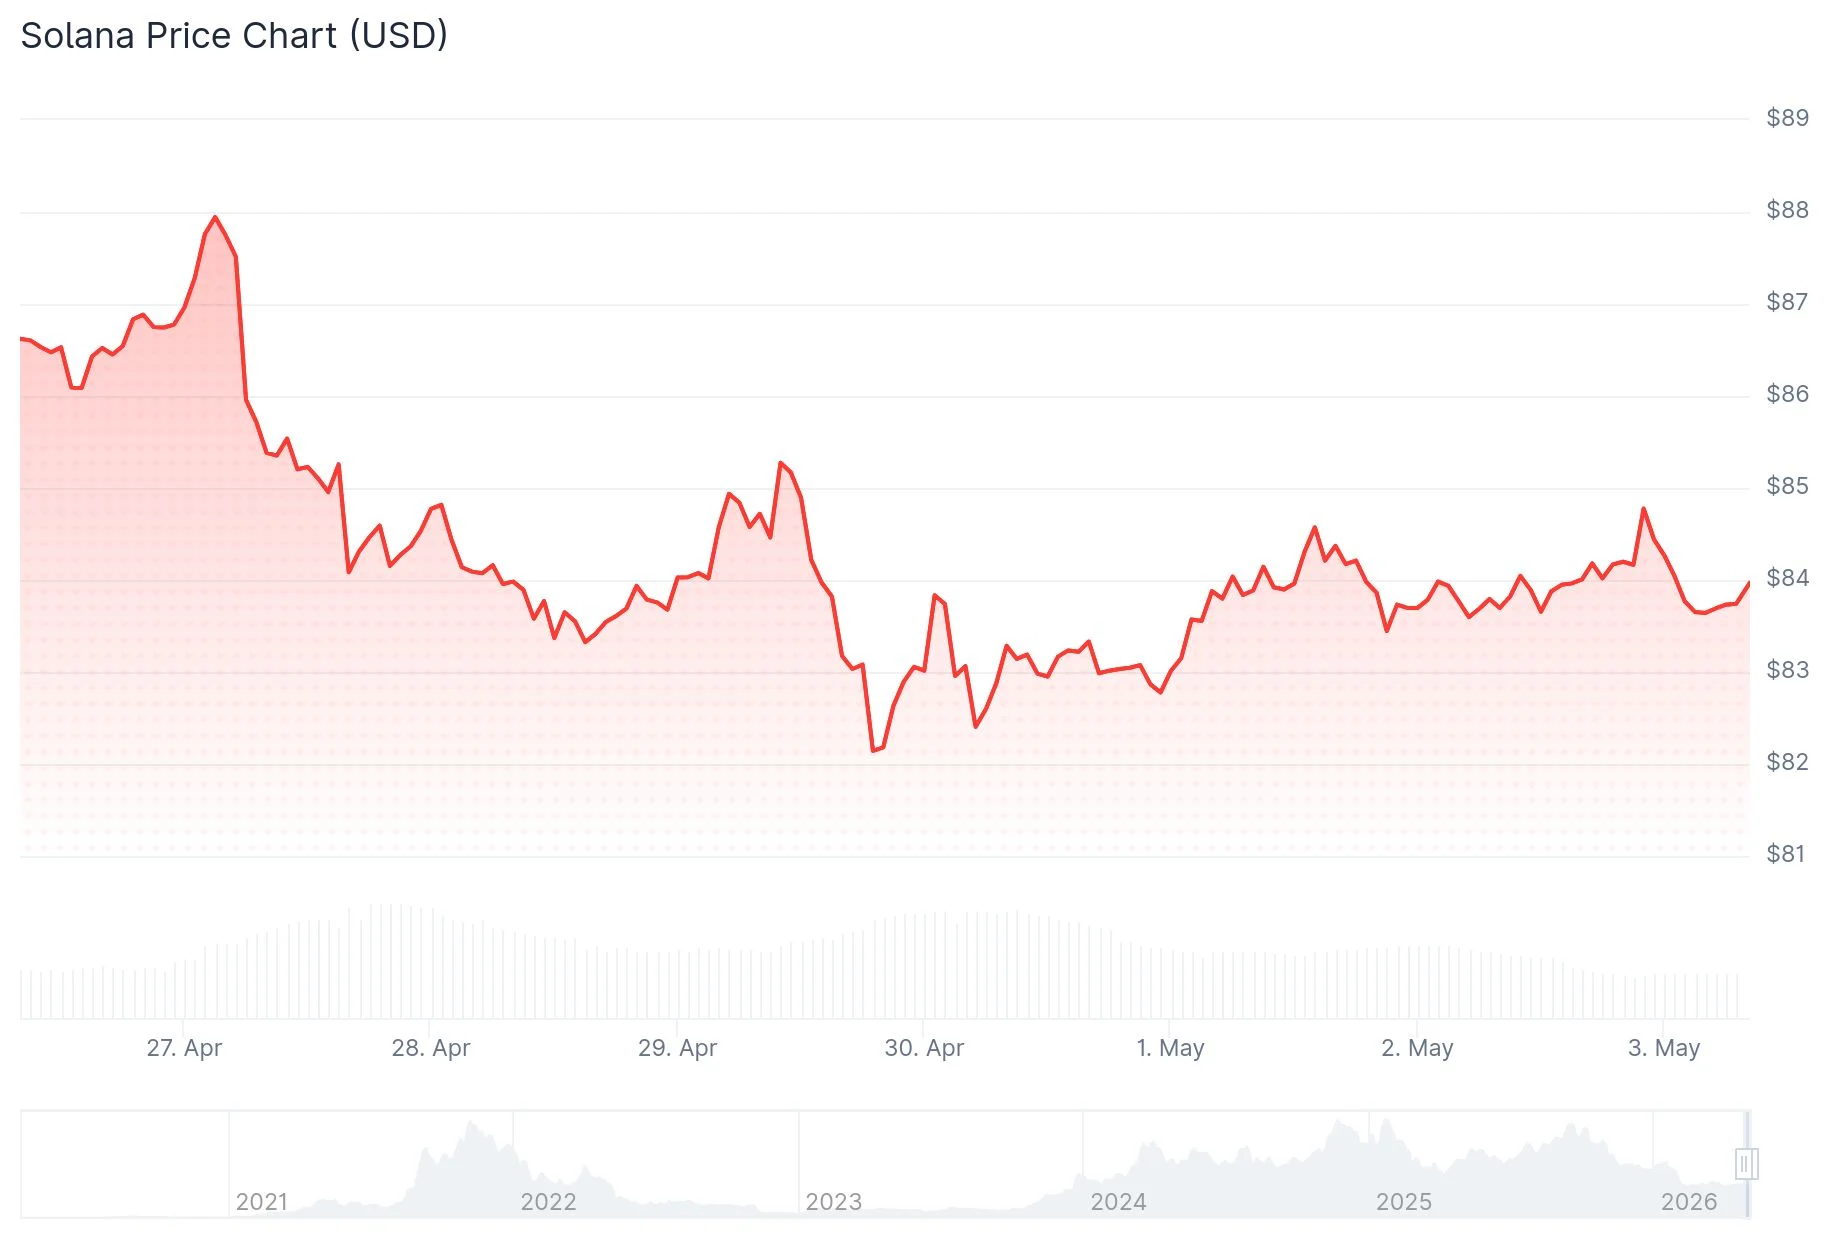
- SOL currently hovers between $80–$85, a price area that previously ignited significant rallies across market cycles.
- Liquidation data reveals concentrated short positions clustered between $84 and $87.
- Bulls must reclaim $106.24 to confirm renewed upward momentum in the market.
- Crypto analyst Patel highlights SOL’s return to the accumulation zone that preceded a 2,200% price increase.
- An extended triangle consolidation pattern suggests a potential breakout ranging from $250–$300 if current support levels hold.
Solana currently finds itself trading within the $80 to $85 range as of this writing, a price territory that has historically marked significant turning points across multiple market cycles. Following a steep decline exceeding 70% from its 2025 peak values, SOL has returned to this familiar zone.
 Solana (SOL) Price
This price region holds substantial historical significance for SOL. During the 2021 bull market, the asset surged from single-digit dollar values to surpass $250. Following the 2022 market downturn that pushed prices near $10, SOL gradually recovered and eventually climbed to fresh highs approaching $290 in the subsequent cycle.
Prominent market analyst Crypto Patel drew attention to this historical parallel in a recent social media post. Patel stated: “$SOL is back at the same buy zone that pumped it 2,200% last cycle. Will it hit $1000 in alt season?” This observation underscores a recurring pattern where this particular price range has consistently functioned as a foundation for substantial upward movements.
Critical Price Levels Under Observation
Liquidation heatmap data provided by CoinAnk reveals accumulating short positions concentrated within the $84 to $87 range. After touching approximately $81, price action has bounced back toward this upper concentration area. These heatmaps identify zones where leveraged traders face potential forced liquidations should price action reach specific thresholds.
Market analyst Don has identified $106.24 as the crucial resistance level that SOL must overcome. Breaking above this threshold would signal a validated shift toward bullish price action. Beyond $106, the next significant target emerges at $260.17, though this remains considerably distant from current levels. Should buyers lose control of present support, the analysis suggests a possible retest of $80 or potentially lower levels.
Triangle Consolidation Builds Tension
Technical analyst Javon Marks presented chart analysis revealing SOL confined within an expansive triangle formation. This pattern demonstrates progressively lower peaks and higher troughs developing over an extended timeframe, a structure that typically precedes significant directional price movement.
Solana presently trades near the bottom boundary of this triangle formation, approximately within the $75 to $85 range. Should buyers successfully maintain this support zone, potential breakout objectives emerge between $250 and $300. Conversely, a breakdown beneath the mid-$60 area would invalidate this technical structure and bring the $45 region into consideration.
As of current market conditions, SOL maintains its position within the $80 to $90 support corridor, with $106.24 standing as the next decisive level bulls must overcome to establish upward control.
The post Solana (SOL) Revisits Critical Support Zone That Fueled Previous 2,200% Surge appeared first on Blockonomi.


You May Also Like

BTC and XRP Price Predictions Fade Out, but APEMARS Starts Drawing the Next Wave of Attention Among Top Crypto Coins

Riot Platforms (RIOT) Shares Surge 7% on Strong Q1 Performance and Data Center Launch


