

Bitcoin Four Year Cycle Faces Doubts as Gold Comparison Signals Bear Trend
Bitcoin cycle doubts grow as gold comparison and market data show short-term recovery but long-term pressure.
Bitcoin’s four-year cycle is facing fresh doubts as traders compare Bitcoin price action with gold.
The debate has grown after Bitcoin reached a dollar-based all-time high before halving, while its performance against gold weakened.
Market data now shows short-term recovery, but wider readings still point to a difficult trend.
Bitcoin Four Year Cycle Faces New Questions
Bitcoin has long been linked to a four-year cycle. The pattern is usually tied to halving events, lower supply growth, and later bull markets.
However, some analysts now question whether that model still works in the current market.
The latest view focuses on Bitcoin’s peak against gold in December 2024.
Under this reading, Bitcoin may have entered a bear market when measured against gold. This has led some traders to review the strength of the last market cycle.
One market analyst stated, “Bitcoin has made a new ATH in dollars, but how much value does that hold?”
The remark points to a key issue. Dollar gains can look strong, but relative value can tell a different story.
Gold Comparison Signals Bear Trend
Bitcoin’s weakness against gold has become a major point in the cycle debate. Gold moved strongly during the period, while Bitcoin failed to follow with the same strength.
This gap created concern among traders who watch Bitcoin as a store of value. The gold comparison also fits with weakness seen across altcoins.
Many altcoins had a hard year, and risk demand stayed limited. Bitcoin also showed pressure over longer periods, even as short-term numbers improved.
The chart shows Bitcoin gained 0.20% over four hours. It also rose 0.37% in 24 hours and 1.25% over seven days.
These numbers show a small recovery, but they do not confirm strong demand.
The 30-day move is stronger, with Bitcoin up 17.48%. This shows buyers returned during the recent month. Yet Bitcoin remains down 26.24% over 180 days and 18.91% over one year.
Read Also:
Long and Short Data Shows Caution
Long and short ratios also show a cautious market. Binance BTC/USDT accounts showed a ratio of 0.599.
OKX BTC accounts showed 0.71, while Binance top trader accounts showed 0.6297.
The Binance top trader position ratio stood at 0.7898. All listed ratios were below 1.0. This means short exposure was higher than long exposure across these markets.
Such readings suggest traders were not fully confident in a bullish move.
However, heavy short exposure can also create sharp moves higher. That can happen when price rises and short sellers close positions.
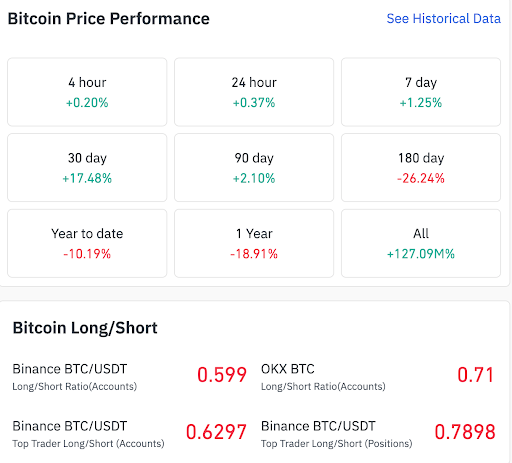 Bitcoin shows recovery, while long-short ratios remain cautious. Source: Coinglass.
The current data presents a mixed picture for Bitcoin price analysis. Short-term Bitcoin momentum has improved, and the 30-day gain remains the strongest reading.
Yet the 180-day, year-to-date, and one-year data still show pressure. The cycle debate may continue if Bitcoin breaks above $100,000 this year.
A move of that size could challenge older market models. It could also support the view that Bitcoin cycles are changing.
For now, the Bitcoin four-year cycle remains under review. The gold comparison has added a new layer to the debate.
Traders are watching whether Bitcoin can regain strength against both the dollar and gold.
The post Bitcoin Four Year Cycle Faces Doubts as Gold Comparison Signals Bear Trend appeared first on Live Bitcoin News.
You May Also Like
Bitcoin UTXO Metrics Hint at a Potential Bear Market Bottom

Token Surpasses $1.14 After Stunning 367% Rally

MetMalaysia issues thunderstorm warning for six states across Peninsular, Sabah and Sarawak

