

Crypto Markets Surge as Trump’s Project Freedom Eases Middle East Tensions
Key Highlights
- Cryptocurrency market capitalization increased 1.88% to reach $2.63 trillion, gaining $47.96 billion within a 24-hour period
- Bitcoin surged past the $80,000 threshold with a 2.29% session increase; Zcash emerged as the top-100 leader, climbing 10%
- President Trump’s “Project Freedom” initiative to provide naval escorts through the Strait of Hormuz reduced geopolitical risks
- US equity futures showed positive movement Sunday evening, with S&P 500, Nasdaq, and Dow contracts all advancing
- Tehran acknowledged receipt of a US peace proposal response, indicating potential diplomatic progress
President Trump unveiled “Project Freedom” on May 3, announcing a US military operation designed to provide protection for commercial vessels navigating the Strait of Hormuz beginning May 4. This declaration sparked a widespread risk-appetite surge across both equity and cryptocurrency markets.
CENTCOM’s deployment includes 15,000 military personnel, guided-missile destroyers, more than 100 aircraft, and unmanned systems. Trump characterized ongoing diplomatic exchanges with Iran as “very positive.”
Iranian officials confirmed on Sunday they had received Washington’s response to their most recent peace overture. Reports indicate the communication was transmitted through Pakistani diplomatic channels, pointing to active behind-the-scenes negotiations.
The development triggered a decline in crude oil prices. Both WTI and Brent crude fell as traders reduced the geopolitical risk premium, allowing capital to flow into equities and digital assets.
US equity futures showed positive momentum. S&P 500 futures advanced 0.2%, Nasdaq 100 futures increased 0.1%, and Dow futures climbed 0.2%. This movement followed Friday’s strong market performance, where both the S&P 500 and Nasdaq reached new all-time highs.
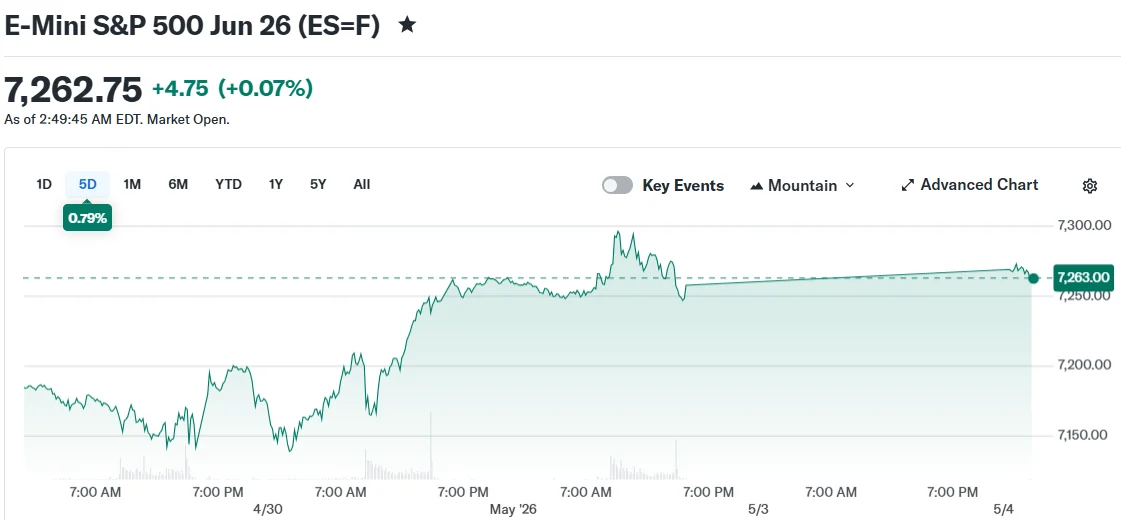 E-Mini S&P 500 Jun 26 (ES=F)
Cryptocurrency markets responded with greater intensity. The aggregate market capitalization advanced 1.88% to $2.63 trillion, representing a $47.96 billion increase since Sunday’s close.
Bitcoin Surges While Zcash Posts Double-Digit Gains
Bitcoin pushed above the $80,000 mark with a 2.29% session gain. Market analysts Tom Lee and Raoul Pal both observed that short interest had reached levels historically associated with market bottoms, with Lee characterizing the recent pullback as a “hidden bear phase” linked to liquidity contraction.
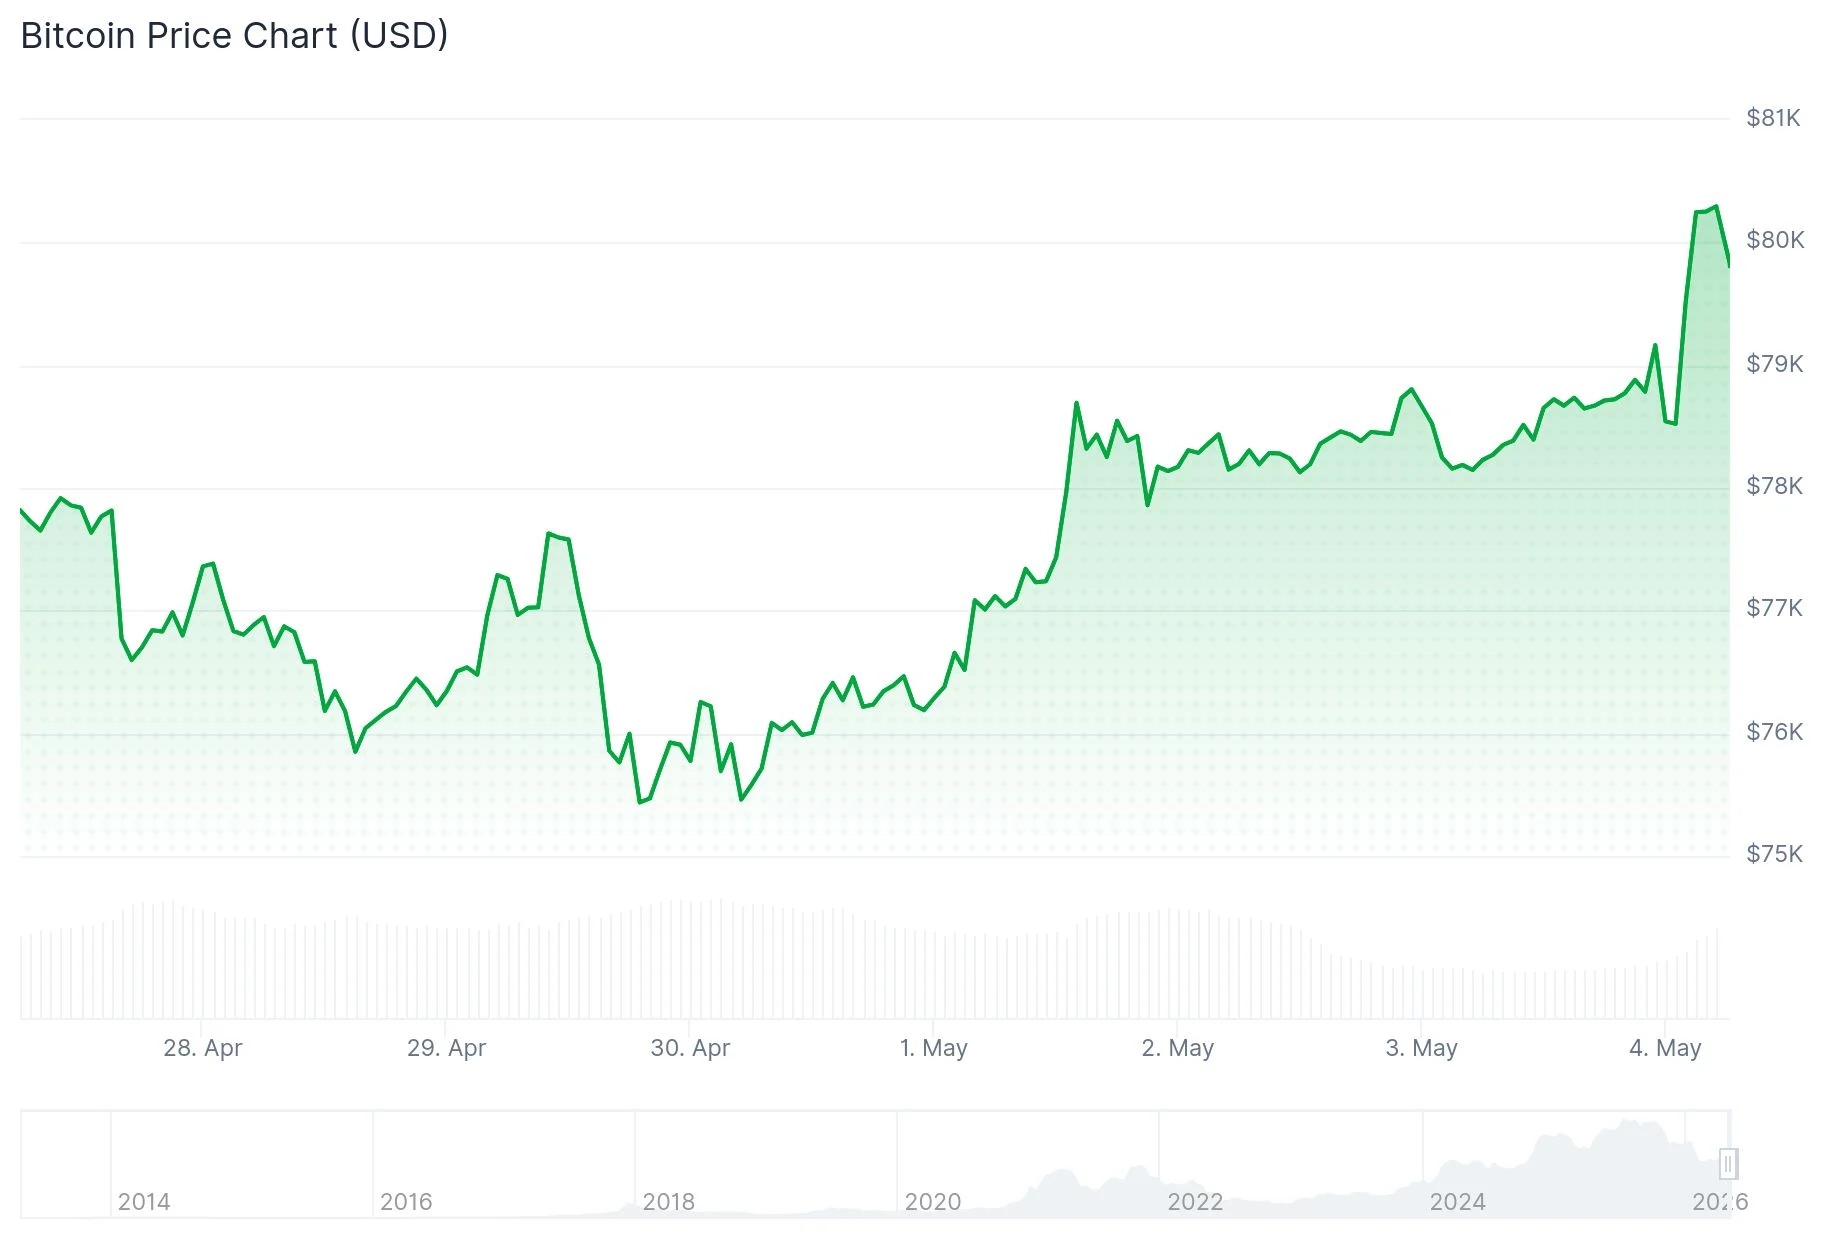 Bitcoin (BTC) Price
Zcash emerged as the top performer among the hundred largest cryptocurrencies, posting a 10% gain over 24 hours after breaking through a multi-month resistance zone on technical charts.
The aggregate cryptocurrency market capitalization has been moving within an upward-sloping channel since February 24. Currently, it’s approaching the upper boundary at $2.65 trillion. A daily close exceeding that threshold would establish a technical target at the 200-day moving average of $2.81 trillion.
The 50-day moving average crossed upward through the 100-day moving average in early May, a technical indicator frequently associated with continued upward momentum.
Ethereum Experiences Massive Validator Exit Queue Growth
Not all developments in the crypto sector were encouraging. Ethereum’s validator exit queue exploded by 72,000%, reaching 433,158 ETH. This dramatic increase followed $625 million in DeFi security breaches during April, including a $292 million compromise of KelpDAO’s bridge infrastructure, linked to North Korea’s Lazarus Group.
Despite the exit surge, Ethereum’s entry queue still contains 3.6 million ETH, representing seven times the volume of the exit queue.
Should the cryptocurrency market fail to sustain levels above $2.65 trillion, technical analysis identifies support zones at $2.56 trillion and $2.49 trillion based on Fibonacci retracement levels.
The post Crypto Markets Surge as Trump’s Project Freedom Eases Middle East Tensions appeared first on Blockonomi.


You May Also Like
Strategy (MSTR) Stock Drops as Company Prepares $1.25B Bitcoin Sale

Bitcoin 28% Haircut: Moody’s Sets Forced-Selling Trigger


