BTC/USDT Spot CVD Chart Analysis: May 9 Volume Heatmap and Order Flow Insights
BitcoinWorld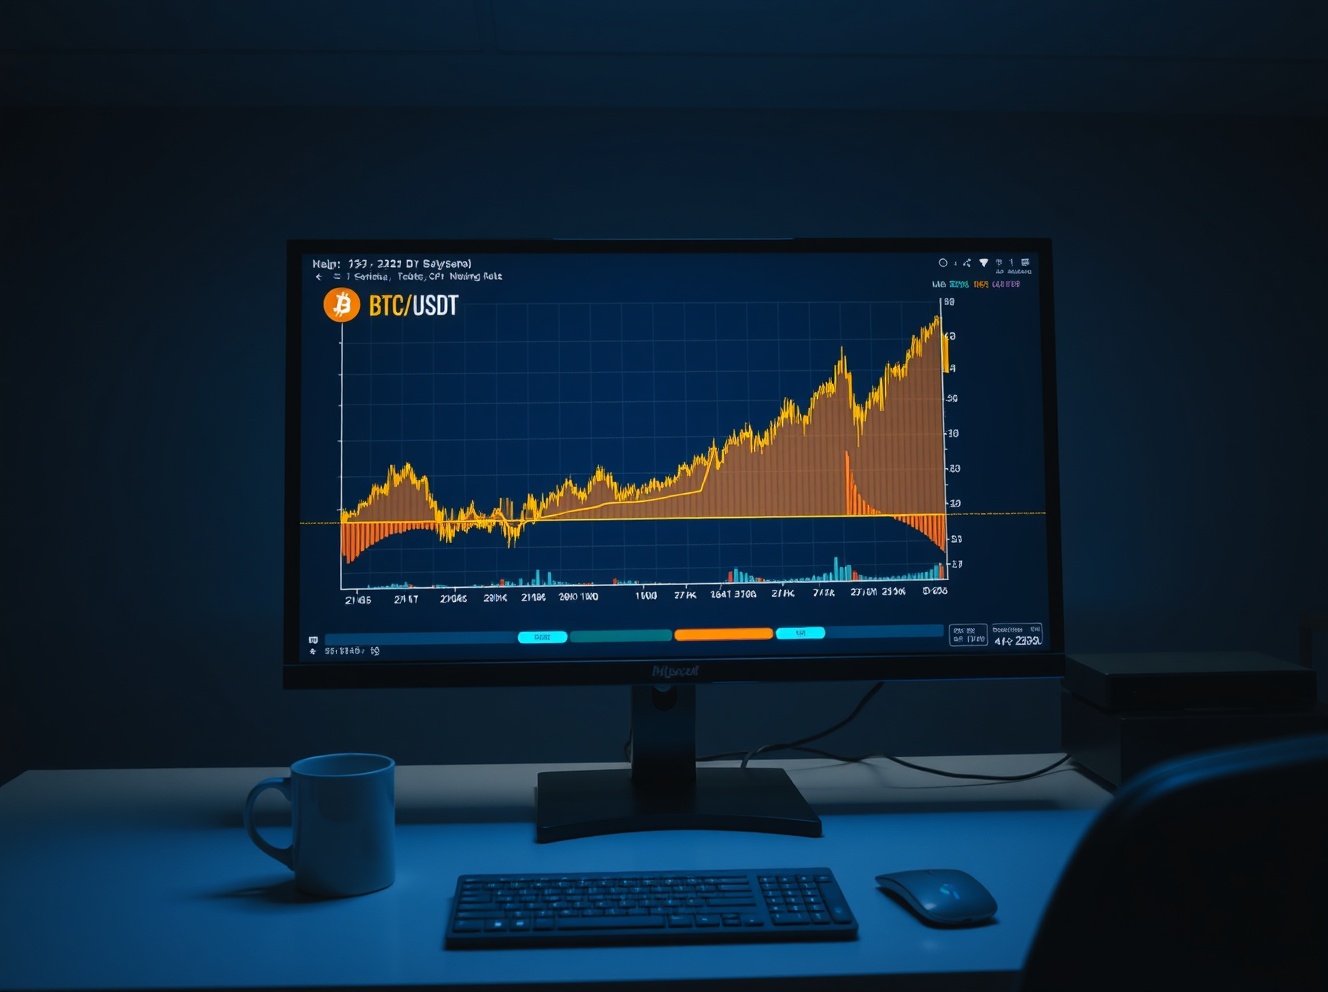
BTC/USDT Spot CVD Chart Analysis: May 9 Volume Heatmap and Order Flow Insights
On May 9, the BTC/USDT spot Cumulative Volume Delta (CVD) chart revealed notable patterns in order flow and volume concentration, offering traders a granular view of market dynamics at specific price levels. The analysis focuses on two key components: the Volume Heatmap and the CVD indicator, which together help identify potential support and resistance zones based on real-time trading activity.
Understanding the Volume Heatmap
The top section of the chart displays a Volume Heatmap, which tracks the scale of trading volume at various price levels. The background color intensifies when the price lingers within a certain range for an extended period or moves significantly. These brighter areas often act as potential support or resistance levels, as they represent zones where substantial trading activity has occurred. On May 9, the heatmap showed heightened activity around the $62,000 to $63,000 range, suggesting that this zone may serve as a key battleground for buyers and sellers in the near term.
Cumulative Volume Delta (CVD) Insights
The lower section of the chart presents the Cumulative Volume Delta, which categorizes buy and sell orders by trade size. As buy orders increase, the corresponding colored line rises. Two specific lines are particularly relevant:
- Yellow line: Represents orders between $100 and $1,000, typically associated with retail traders.
- Brown line: Represents large orders between $1 million and $10 million, often linked to institutional or whale activity.
On May 9, the brown line showed a noticeable uptick, indicating that large-scale buyers were accumulating Bitcoin near the $62,500 level. Meanwhile, the yellow line remained relatively flat, suggesting that retail participation was less aggressive. This divergence between retail and institutional order flow can signal a potential shift in market sentiment, with larger players positioning for a move higher.
Implications for Traders
For traders monitoring the BTC/USDT pair, the CVD chart provides a real-time snapshot of order book dynamics. The bright zone in the Volume Heatmap around $62,000–$63,000, combined with the rising brown CVD line, suggests that this area may act as a support level in the short term. Conversely, if the price fails to hold above this zone and the brown line begins to decline, it could indicate that large sellers are stepping in, potentially leading to a breakdown. Traders should watch for confirmation from other indicators, such as volume spikes or candlestick patterns, before making trading decisions.
Conclusion
The BTC/USDT Spot CVD chart analysis for May 9 highlights the importance of monitoring order flow and volume concentration to identify key price levels. The Volume Heatmap points to a significant trading zone around $62,000–$63,000, while the CVD indicator reveals that institutional-sized orders are driving recent buying pressure. As always, traders should use this data as part of a broader strategy, combining it with other technical and fundamental analysis to navigate the volatile cryptocurrency market.
FAQs
Q1: What is the Cumulative Volume Delta (CVD) indicator?
The CVD indicator tracks the net difference between buying and selling volume at each price level, categorized by trade size. It helps traders identify whether large or small traders are driving price movements.
Q2: How does the Volume Heatmap help in trading?
The Volume Heatmap visualizes trading volume concentration at specific price levels. Brighter areas indicate higher activity, which can act as potential support or resistance zones due to the clustering of orders.
Q3: Why is the brown CVD line important for Bitcoin analysis?
The brown line represents large orders between $1 million and $10 million, often associated with institutional or whale activity. Changes in this line can signal shifts in market sentiment and potential price direction.
This post BTC/USDT Spot CVD Chart Analysis: May 9 Volume Heatmap and Order Flow Insights first appeared on BitcoinWorld.


You May Also Like

Can hyperliquid onchain and Bitget Wallet bring Wall Street markets to DeFi?
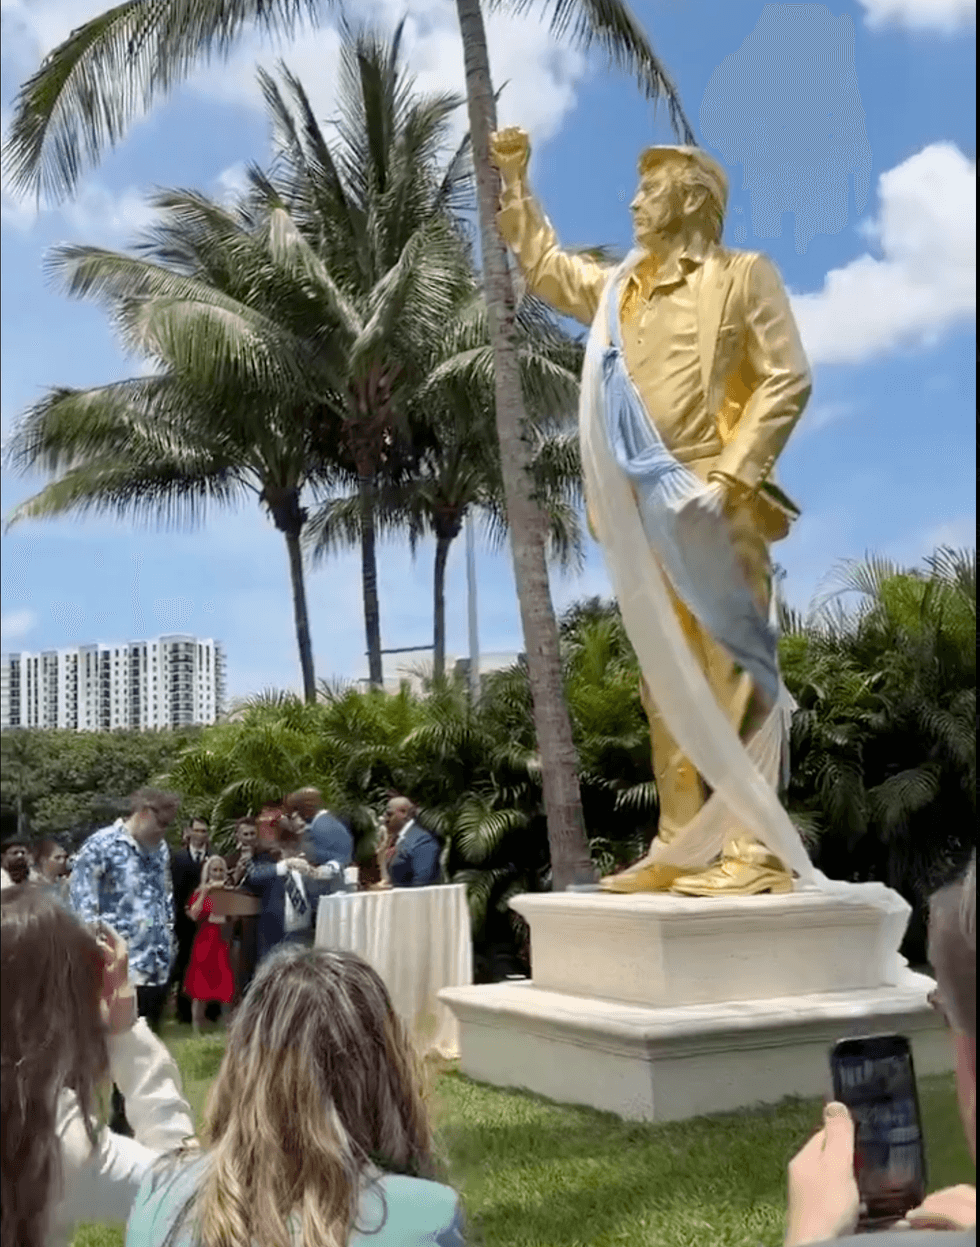
Trump's giant gold statue at his golf club triggers online disgust and disbelief