Ripple Price Analysis: XRP Momentum Shifts Bullish Against Both USD and BTC
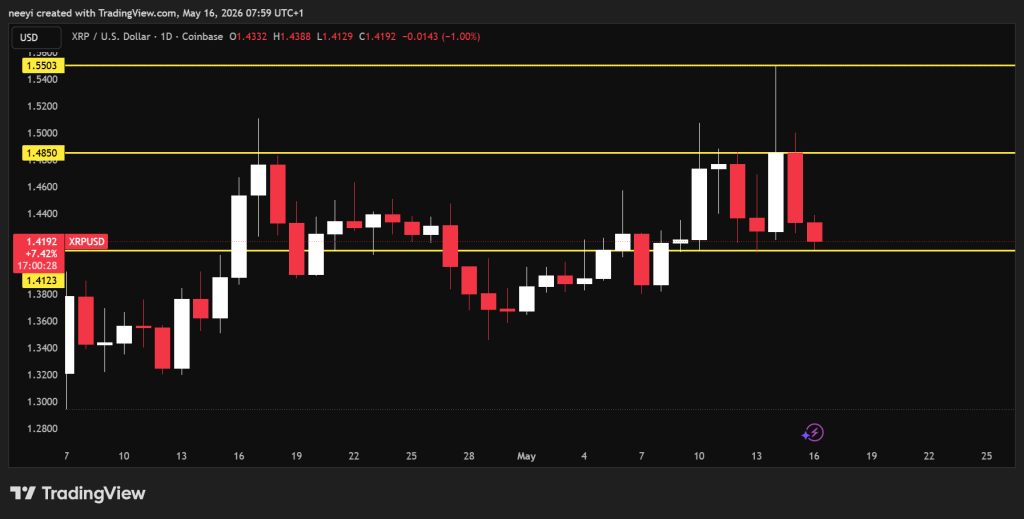
XRP is trading at $1.43, rising above the most technically significant resistance cluster it has faced in months. The price has simultaneously broken the 100-day MA and the descending channel’s upper boundary on the USDT pair, while the BTC pair breaks above a short-term resistance level. For the first time this cycle, both pairs are showing genuine strength at the same time, and the RSI on each is backing it up.
Ripple Price Analysis: The USDT Pair
XRP is finally consolidating above the convergence of the declining 100-day MA at approximately $1.40 and the descending channel’s upper boundary on the USDT pair. The RSI has also climbed to the 55-60 range and is sustaining rather than fading. This suggests the buying pressure behind this approach is more durable than prior attempts.
A sustained daily close above the psychological $1.50 mark can confirm the breakout and pave the road toward the $1.80 supply zone. The 200-day moving average, also located around the same zone, could also be reclaimed if momentum sustains. This would be the signal that many investors sitting on the sidelines would want to see before entering the market again and going long on XRP for the coming months.
The BTC Pair
There is also a notable development on the BTC pair. The price is breaking testing the recent low around 1,800 sats after a recovery from 1,700. This move has been accompanied by a bullish RSI divergence and recovery from oversold levels, which is the reversal pattern many traders look for after a liquidity sweep below a significant level.
If the 1,800 sats level is reclaimed, the next meaningful resistance sits at the 2,000 sats zone, where the 100-day moving average is declining, followed by the 200-day moving average at approximately 2,100 sats.
A reclaim of 2,000 sats area would be the first genuine sign that XRP’s multi-month underperformance against Bitcoin is beginning to reverse. A consolidation above 1,800 sats would be an encouraging development, but the heavier structural work remains ahead.
The post Ripple Price Analysis: XRP Momentum Shifts Bullish Against Both USD and BTC appeared first on CryptoPotato.


You May Also Like

Fed Governor Calls For Strong Stablecoin Oversight As CLARITY Act’s Final Text Gets Delayed
Crypto Price Prediction for Today, May 16: XRP, Solana (SOL), Ethereum (ETH)