CoreWeave Stock Sheds 15%: Can a $100B Backlog Offset Meta’s Threat?
CoreWeave stock is under heavy pressure. CRWV closed July 1 at $85.69, tumbling after reports Meta may sell excess AI compute capacity. The stock shed roughly 15% in days, and the technical picture across all timeframes confirms the damage is real — though not necessarily final.
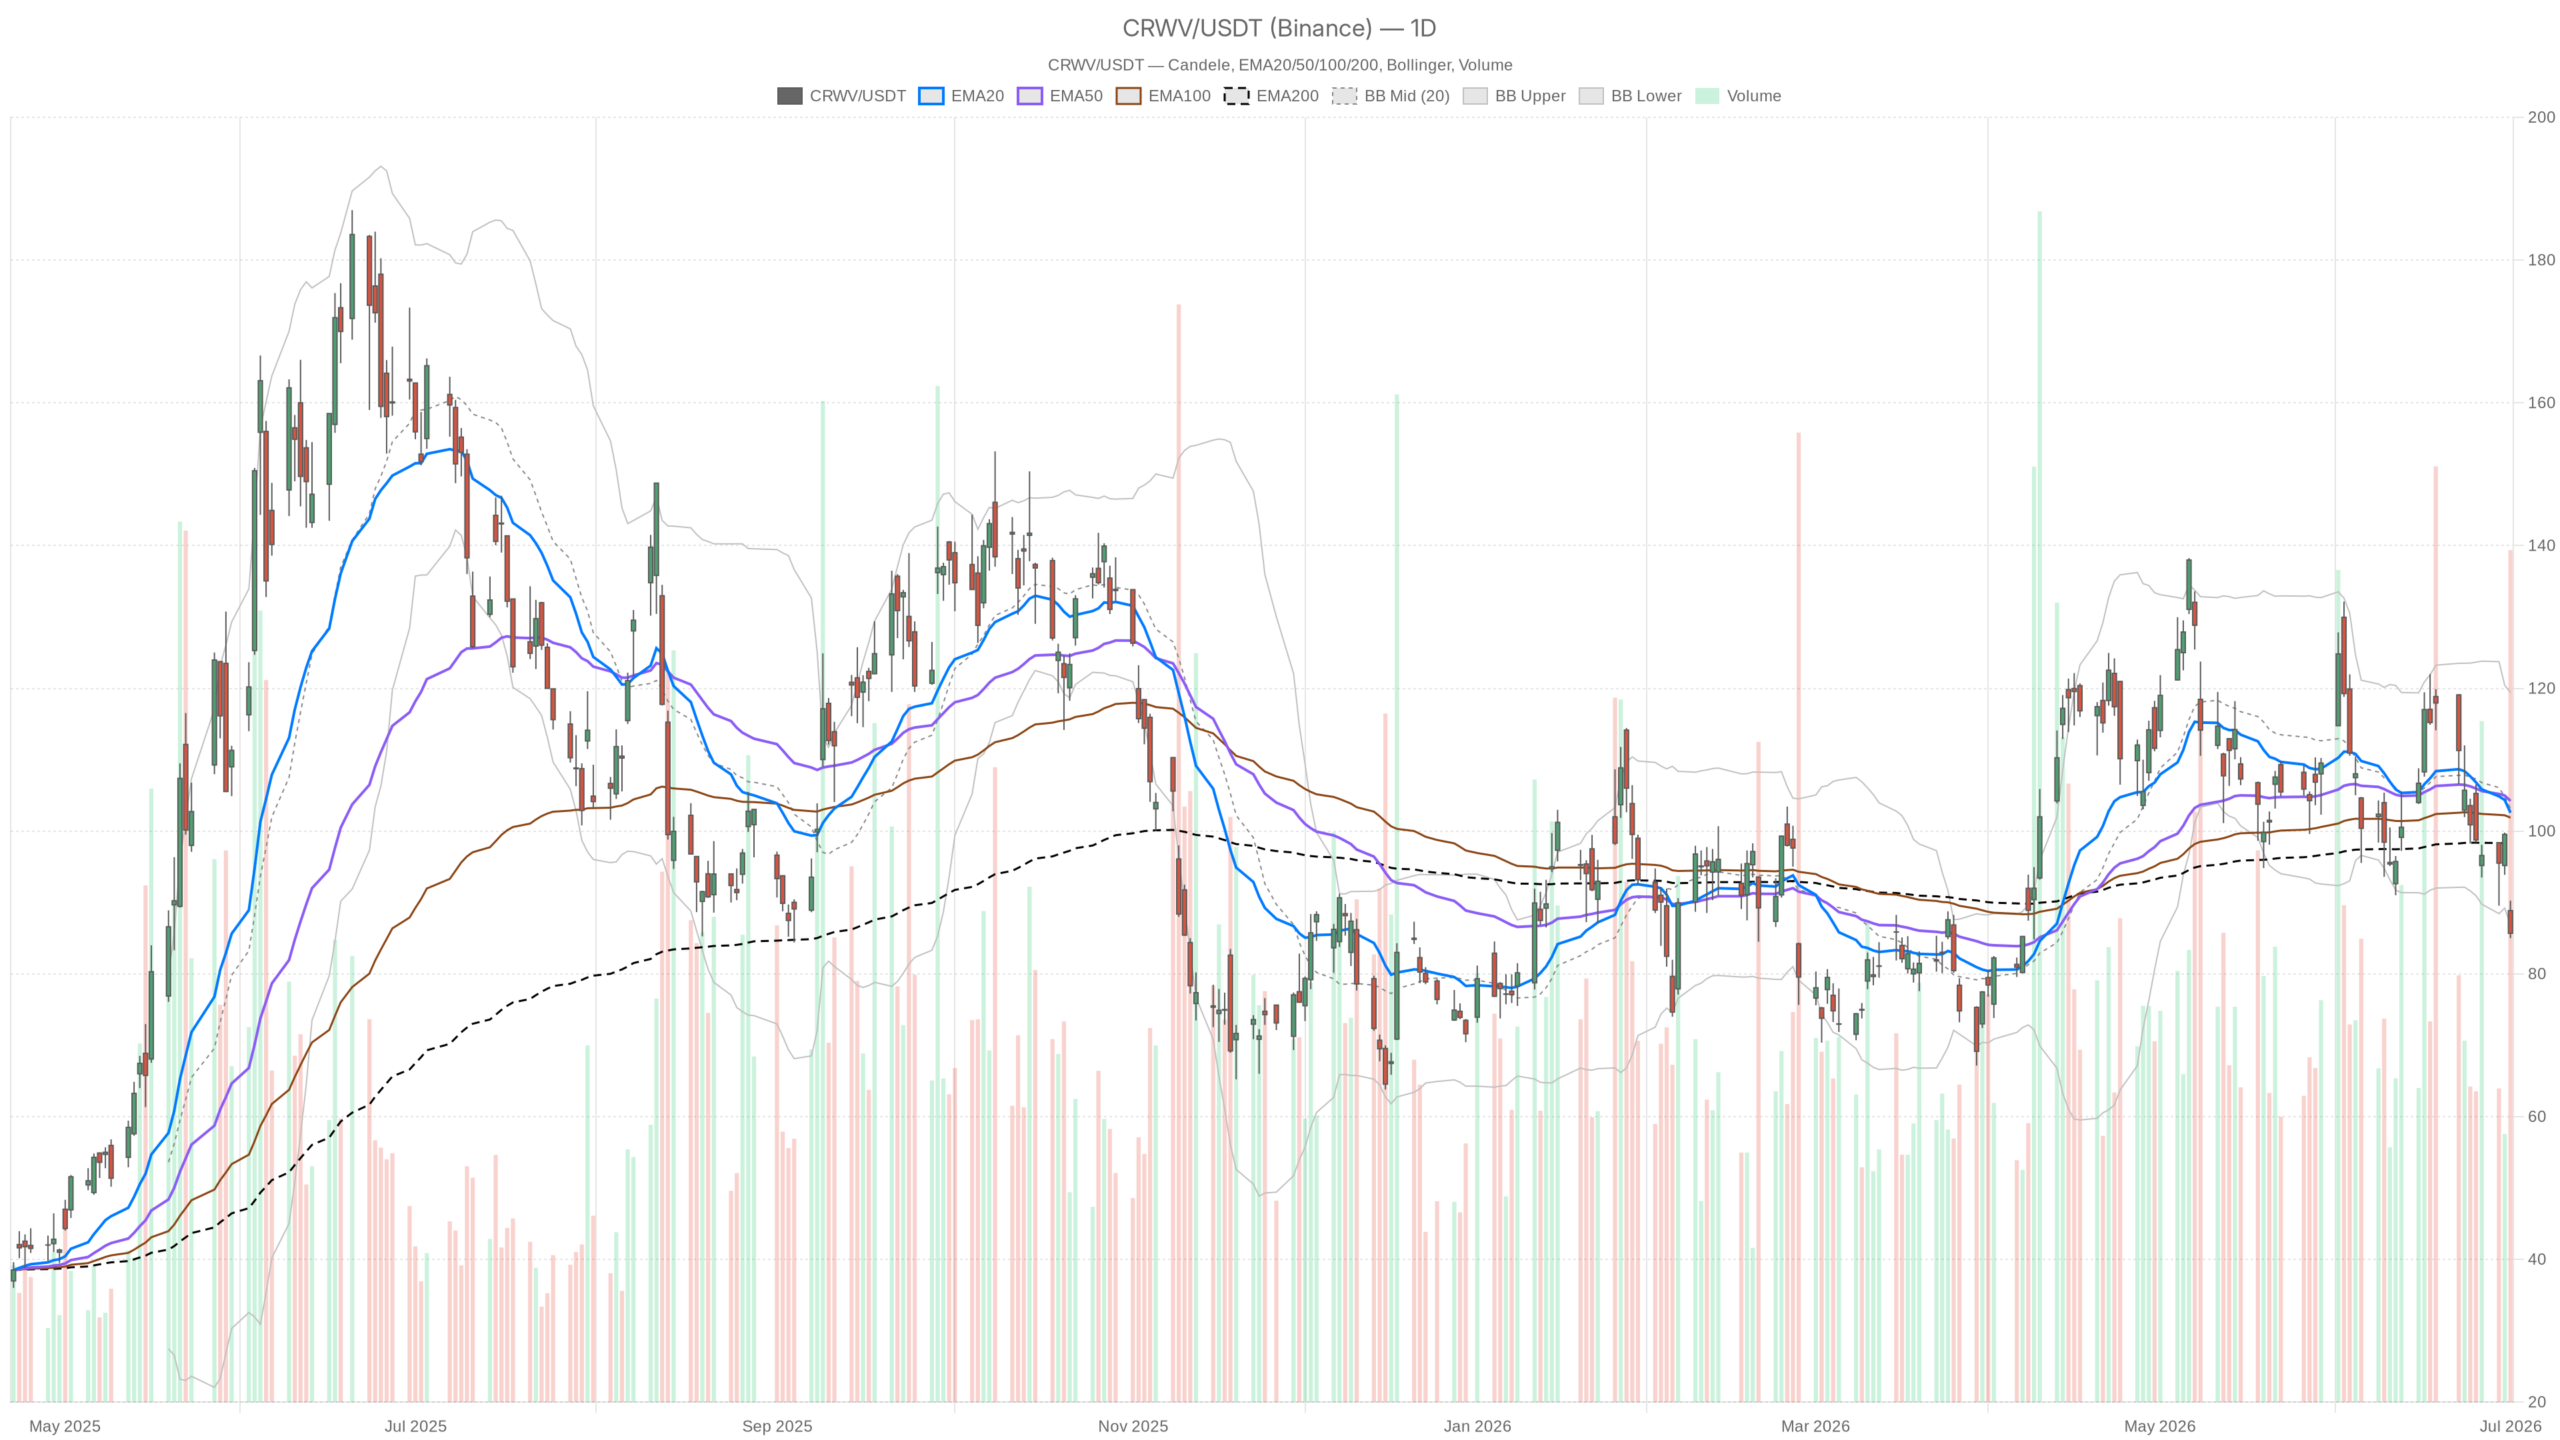 CRWV — daily chart with candlesticks, EMA20/EMA50 and volume.
Key takeaways
- CRWV dropped roughly 15% after reports Meta plans to sell surplus AI compute capacity to third parties
- Price trades below all major daily moving averages, confirming a structurally bearish posture
- Daily RSI at 35.78 signals aggressive selling, while the MACD remains firmly negative
- Bullish case hinges on reclaiming $86.99; bearish breakdown below $83.71 could target the low $70s
- CoreWeave’s $100 billion backlog and European expansion offer fundamental counterpoints to the selloff
CoreWeave Stock Price Action: Daily Timeframe Signals
CRWV’s daily chart shows a structurally bearish posture, with price below all three major moving averages and momentum firmly negative. The trend has shifted against bulls in the medium term.
Moving Averages Confirm Structural Weakness
At the same time, price trades well below the EMA20 at $102.58 and the EMA50 at $104.23. Both are converging from above, reinforcing the bearish tilt. The EMA200 sits at $98.22. CRWV is currently below all three. This signals that the dominant trend has shifted against buyers, at least in the medium term.
Momentum and Volatility Paint a Bearish Picture
Meanwhile, daily RSI has fallen to 35.78 — hovering just above classical oversold territory. This does not automatically signal a reversal. However, it confirms the selling has been aggressive and stretched. The MACD reinforces the bearish read: the line sits at -3.54 versus a signal at -1.71, with a negative histogram of -1.83. Momentum is firmly negative and still accelerating on the daily chart. No cross or divergence yet hints at stabilization.
The Bollinger Bands also add useful context. The lower band sits at $86.90, and CRWV closed at $85.69 — a breach of that band. When price closes below the lower Bollinger Band, it generally reflects extreme short-term selling. In itself, this can precede short-covering bounces. However, in a fundamentally-driven selloff like this one, band breaches can persist. The daily ATR of $8.71 underlines how volatile CoreWeave stock currently is.
On the pivot front, the daily pivot point sits at $86.99, with R1 at $88.96 and S1 at $83.71. CRWV is trading below its pivot — another sign bears hold intraday control. A reclaim of $86.99 would be the first meaningful signal that pressure is easing. Failure to hold $83.71 would open a path toward fresh multi-week lows.
CoreWeave Stock Intraday Breakdown: H1 and 15m Charts
The intraday picture deepens the bearish case. The hourly chart is fully aligned to the downside, while only the 15-minute chart offers faint stabilization signals.
Hourly Chart Reinforces the Downtrend
The H1 regime is explicitly bearish. Price sits at $85.69, crushed below the H1 EMA20 ($92.24), EMA50 ($97.20), and EMA200 ($104.61). That full stack of bearish EMA alignment on the hourly chart confirms this is not just a daily-level blip. The intraday structure is broken.
Notably, H1 RSI has dropped to 30.22 — nearly in oversold territory. The hourly MACD shows the line at -3.24 against a signal of -2.49, with a histogram of -0.75. The histogram is negative but narrowing slightly. This could point to a very early slowing of downside momentum. Still, it would take a confirmed bullish MACD cross on the hourly to suggest meaningful intraday stabilization. A price reclaim above H1 pivot resistance of $87.16 would also be required.
15-Minute Chart Hints at Short-Term Stabilization
However, the 15-minute timeframe offers the only sliver of near-term relief. The 15m MACD histogram has flipped marginally positive at 0.23. The MACD line at -1.47 is starting to cross above the signal at -1.71. RSI on the 15m sits at 33.38 — still depressed, but potentially trying to base.
The Bollinger Bands are tight, with upper at $88.11 and lower at $85.57. This suggests the immediate range is compressed. A break above $86.10 (15m R1) would be the first micro-level signal for potential short-term relief.
What’s Driving CoreWeave Stock Lower: The Meta Factor
The selloff is driven by reports that Meta is weighing the sale of surplus AI compute capacity. This move threatens CoreWeave’s competitive position directly.
Overall, the fundamental catalyst is well-defined. Meta’s potential entry as a cloud compute supplier introduces a new competitive dimension. The concern is dual: Meta is both a potential customer and now a potential competitor. D.A. Davidson’s technology research head Gil Luria described the scenario as “very bad” for CoreWeave and peers.
In contrast, Evercore ISI has maintained its rating, offering institutional counterweight. Seeking Alpha analysts argue the selloff is mispriced given CoreWeave’s reported $100 billion backlog and expanding European AI cloud infrastructure. CoreWeave’s recent product launches demonstrate strategic momentum. These include the ARIA AI research agent integrated with Weights & Biases and a European co-location deal with Conapto. However, these positives are currently overridden by the macro fear of Meta becoming a cloud compute supplier.
CoreWeave Stock Scenarios: Bullish vs. Bearish
The bullish case depends on reclaiming key technical levels and institutional support. The bearish scenario points to a potential drop toward the low $70s if support fails.
Specifically, the bullish scenario hinges on a few conditions. First, price needs to reclaim and hold above the daily pivot at $86.99 on a closing basis. Second, momentum indicators on the daily must show divergence — specifically, RSI holding above 30 while price stabilizes. If the $100 billion backlog story gains traction, institutional buyers could step in. Additional analyst affirmations alongside Evercore’s rating would reinforce this move. A recovery toward the $93–$98 range would represent a partial mean reversion.
On the other hand, the bearish scenario is more straightforward. A daily close below $83.71 — the daily S1 — would confirm that support has failed. Below that, there is limited technical structure to hold price. Given an ATR of $8.71, a move to the low $70s cannot be dismissed if the Meta competitive narrative deepens. If additional hyperscalers follow Meta’s lead, CoreWeave’s premium valuation becomes increasingly difficult to justify.
CRWV Key Levels and Outlook
CoreWeave stock remains in a clearly bearish near-term posture. Both daily and hourly timeframes are aligned to the downside, with limited signs of reversal.
Still, only the faintest early signals on the 15-minute chart suggest a possible short-term pause. The fundamental catalyst is genuine and unresolved. Positioning in this environment demands caution. Volatility remains elevated. The next directional move will likely hinge on further Meta cloud developments. A broader recalibration of AI infrastructure valuations could also serve as a catalyst. Until price reclaims key moving averages or the Meta narrative is directly refuted, the burden of proof sits squarely with the bulls.
FAQ
Why is CoreWeave stock falling?
Reports that Meta may sell excess AI compute capacity to third parties sparked the selloff. This raised fears of direct competition in the cloud AI infrastructure market, threatening CoreWeave’s customer base.
What are the key levels to watch for CRWV?
Bulls need to reclaim $86.99, the daily pivot point. Bears are targeting $83.71, the daily S1. A breakdown below that level could open the path toward the low $70s.
Is the CoreWeave stock selloff overdone?
Some analysts argue yes, citing CoreWeave’s $100 billion backlog and European expansion. However, the technical picture remains bearish until price reclaims key moving averages and the Meta narrative is resolved.
What does CoreWeave’s backlog mean for the stock?
The reported $100 billion backlog provides a fundamental cushion and long-term revenue visibility. However, the market is currently prioritizing the competitive threat from Meta over this backlog strength.
Disclaimer: This article is for informational purposes only and does not constitute financial advice, an investment recommendation, or a solicitation to buy or sell any financial instrument or cryptocurrency. The analysis provided is not indicative of future results. Investing in crypto assets and financial markets carries a high risk of capital loss. Always do your own research (DYOR) and consult a qualified financial advisor before making any decision.
Article produced with the assistance of artificial intelligence and reviewed by the editorial team.


You May Also Like
Cathie Wood’s ARK Invest Buys $13.7M in Circle Shares While Selling Robinhood Stock

The changing face of elder care in Malaysia — Sayed Mohammad Reza Yamani Sayed Umar

One Of Frank Sinatra’s Most Famous Albums Is Back In The Spotlight