Dogecoin price has plummeted to a local bear market after falling by over 38% from its highest point in September, and an emerging risky pattern points to further downside. Dogececoin price death cross pattern forms Dogecoin (DOGE) price has crashed…Dogecoin price has plummeted to a local bear market after falling by over 38% from its highest point in September, and an emerging risky pattern points to further downside. Dogececoin price death cross pattern forms Dogecoin (DOGE) price has crashed…

Dogecoin price warning: death cross nears as DOGE ETF momentum fades

2025/10/22 22:21
2 min read
For feedback or concerns regarding this content, please contact us at crypto.news@mexc.com

Dogecoin price has plummeted to a local bear market after falling by over 38% from its highest point in September, and an emerging risky pattern points to further downside.

Summary
  • Dogecoin price is about to form a death cross pattern on the daily chart.
  • The recently launched DOGE ETF has lost momentum in terms of inflows.
  • DOGE futures open interest has crashed in the past few weeks.

Dogececoin price death cross pattern forms

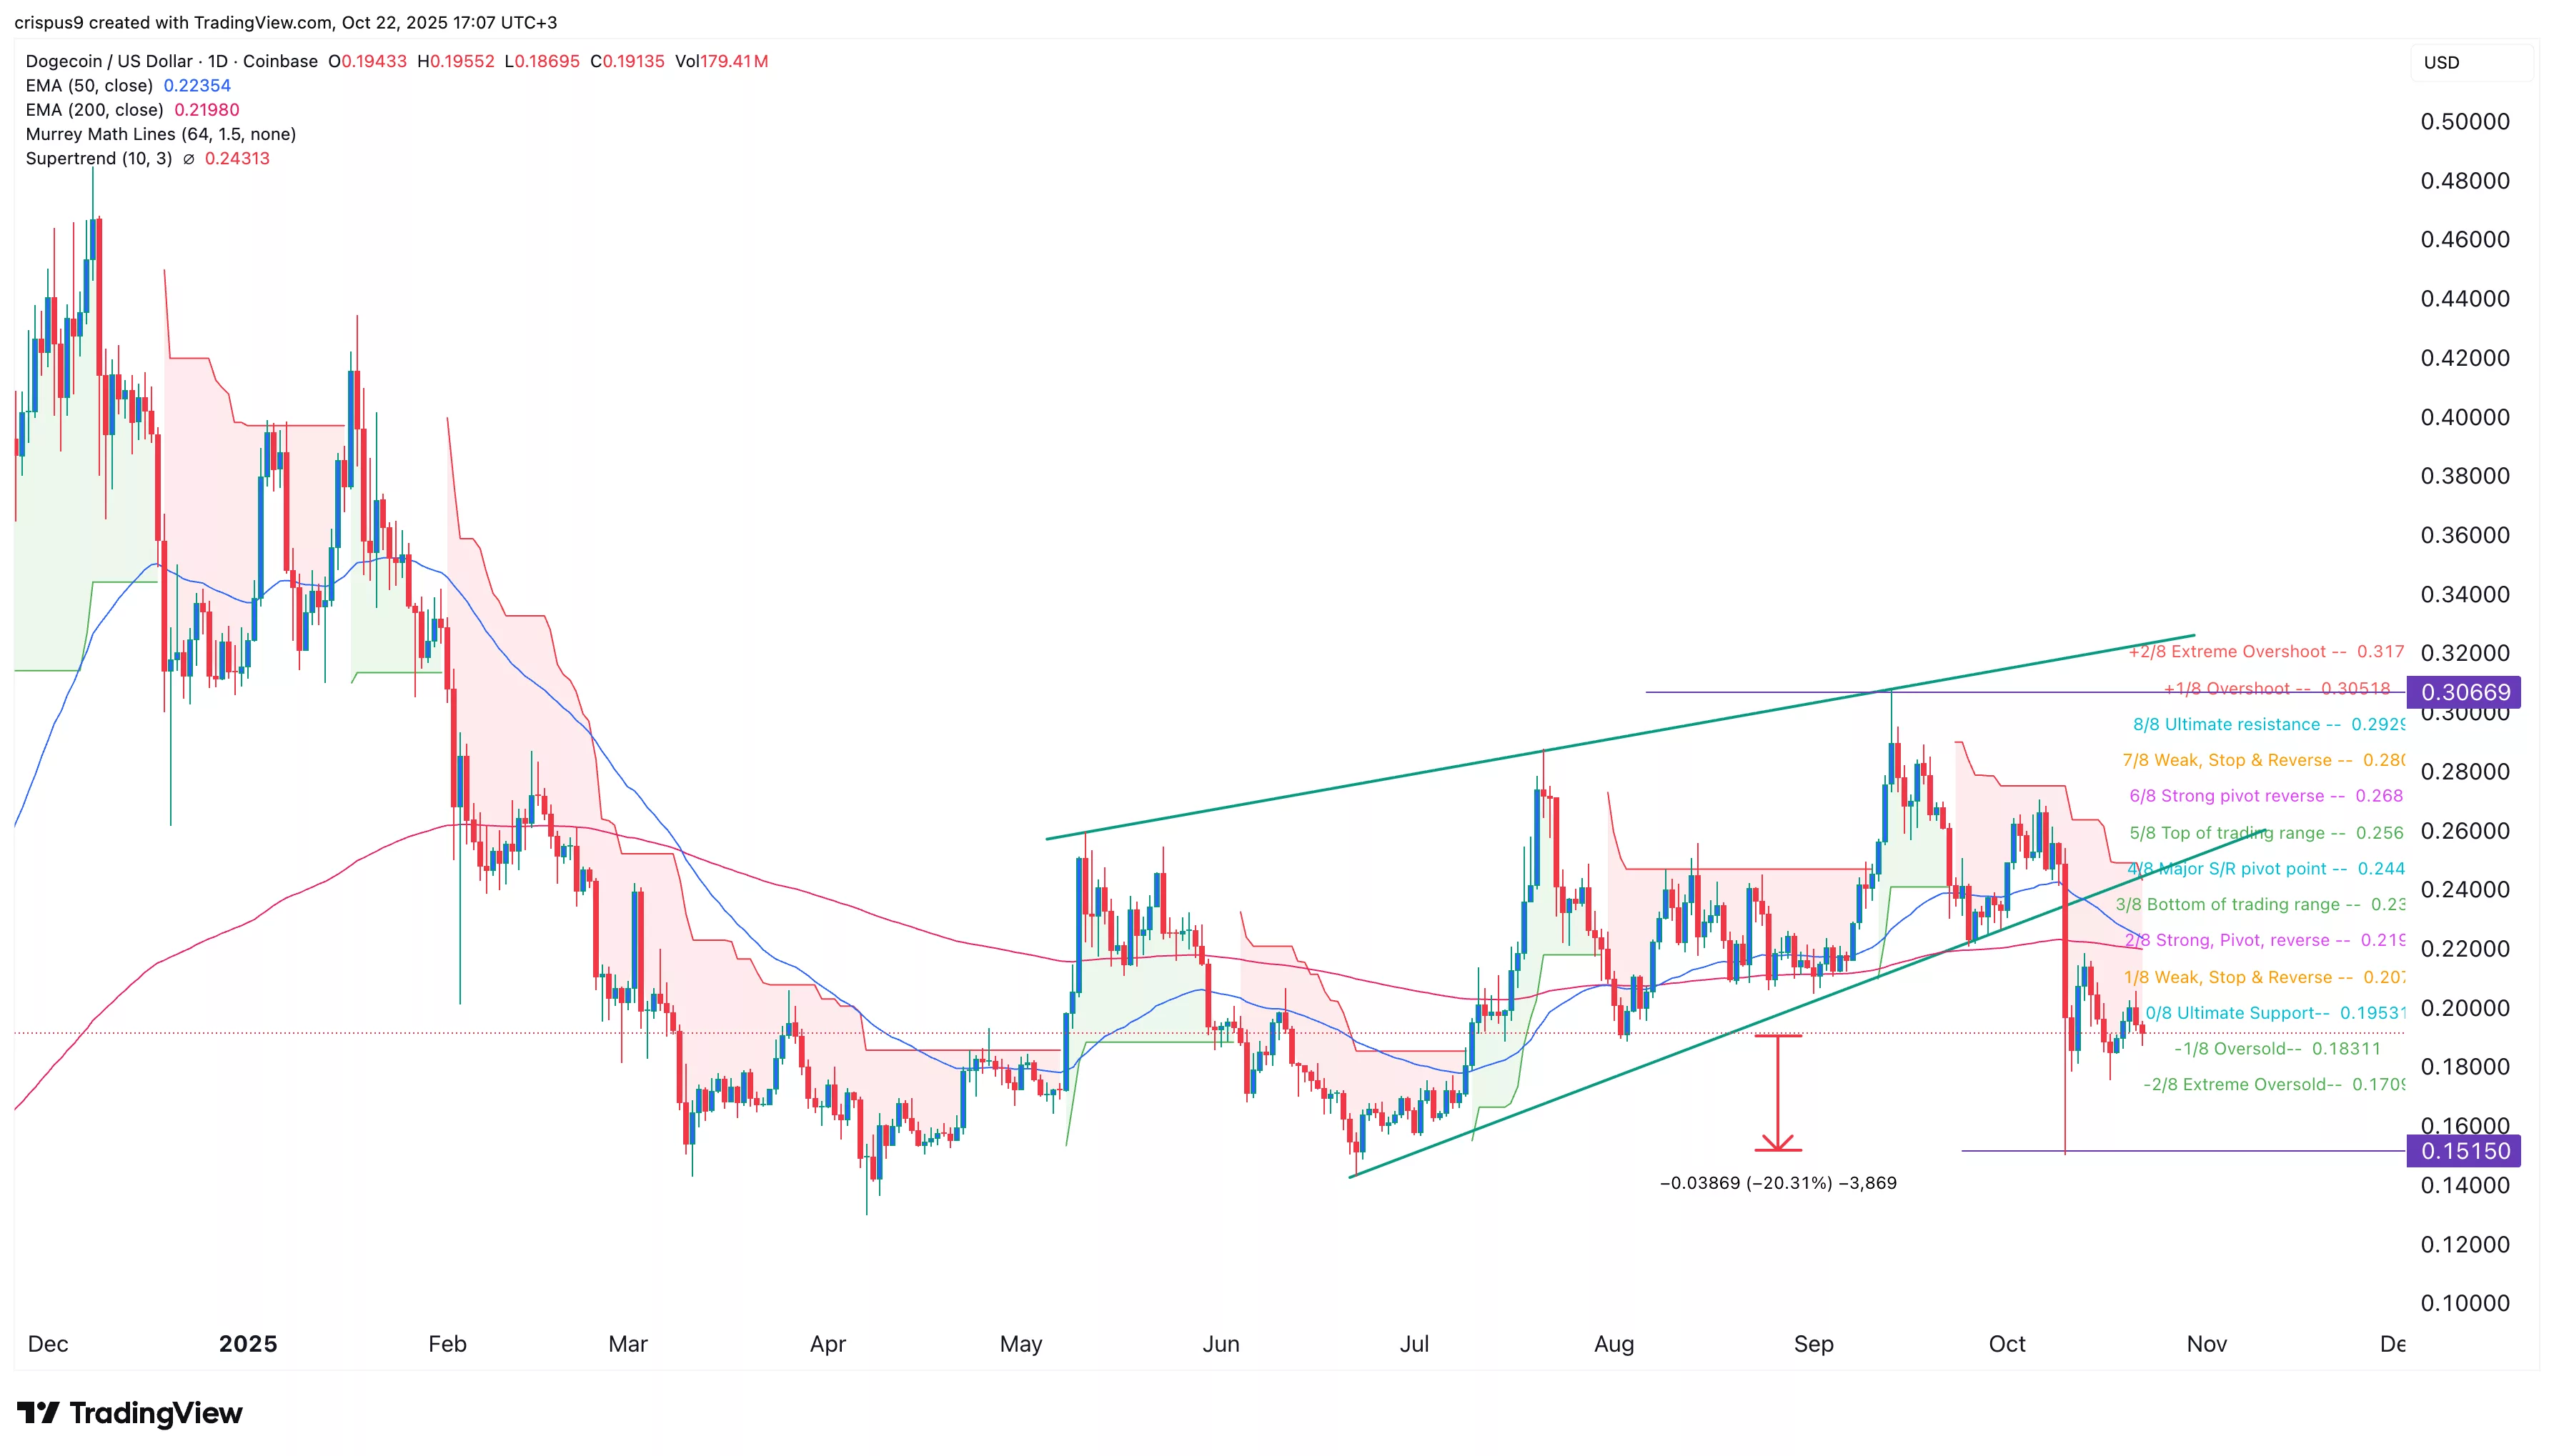
Dogecoin (DOGE) price has crashed from the September high of $0.3066 to $0.1900 today. This performance happened because of the recent crypto market crash that led to substantial liquidations.

DOGE price also dropped after the token formed a rising wedge pattern, which is made up of two ascending and converging trendlines. It often leads to a bearish breakout, which occurs when the two lines near confluence.

Dogecoin is now about to form a death cross, which happens when the 50-day and 200-day Exponential Moving Averages cross. It will be the first time that the token has formed this cross since March.

DOGE price has also moved below the ultimate support of the Murrey Math Lines tool. It has also moved below the Supertrend indicator and the Ichimoku cloud.

Therefore, the token will likely continue falling as sellers target this month’s low of $0.1515. Such a move would point to a 20% plunge from the current level. On the flip side, a move above the strong pivot and reverse point at $0.2150 will invalidate the bearish outlook.

Dogecoin price

DOGE ETF inflows and futures open interest falls

Third-party data shows that the recently launched REX-Osprey DOGE ETF growth has stalled. According to its website, the DOGE ETF has accumulated $32 million in assets, much lower than the REX-Osprey XRP ETF, which has crossed the $100 million milestone. The two funds were started on the same day.

Data by ETF.com shows that the fund has not had any inflows in the past two trading days. That is likely because investors are staying on the sidelines as the Crypto Fear and Greed Index remains in the red.

DOGE ETF
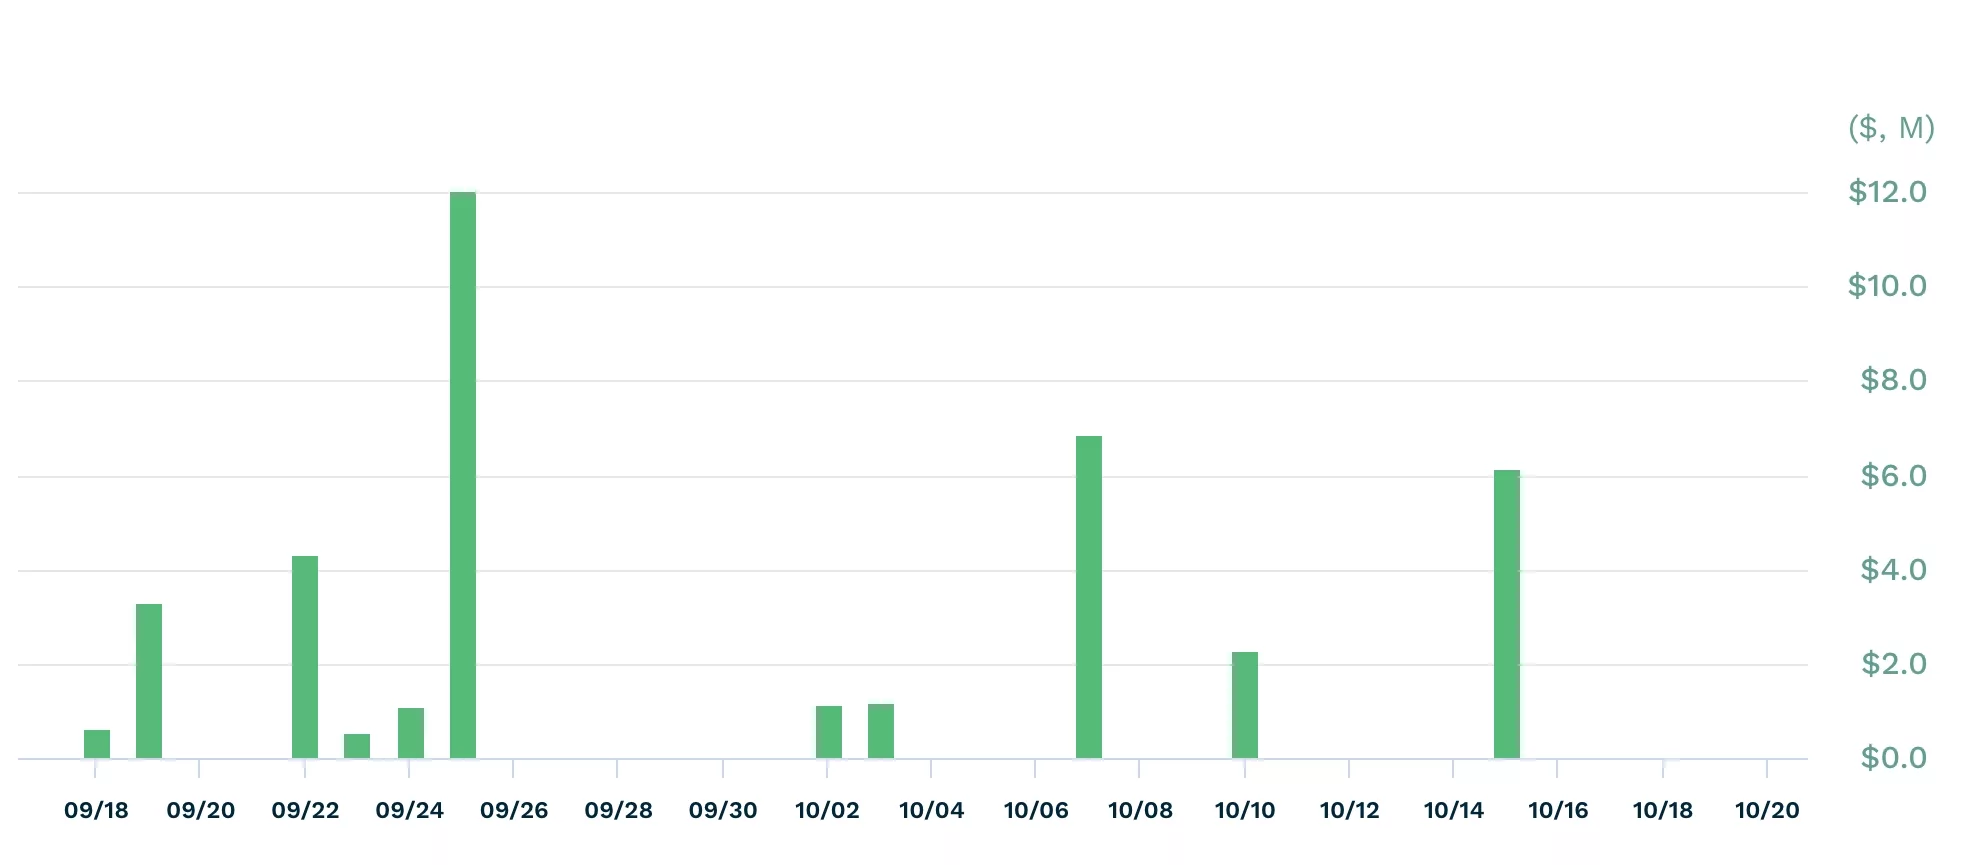
DOJE ETF inflows | Source: ETF

Meanwhile, more data shows that Dogecoin’s futures open interest has plunged to $1.85 billion, the lowest level since June 25. It has moved from the year-to-date high of $6 billion, a sign that its demand is waning.

Market Opportunity
CROSS Logo
CROSS Price(CROSS)
$0.07094
$0.07094$0.07094
+1.08%
USD
CROSS (CROSS) Live Price Chart
Disclaimer: The articles reposted on this site are sourced from public platforms and are provided for informational purposes only. They do not necessarily reflect the views of MEXC. All rights remain with the original authors. If you believe any content infringes on third-party rights, please contact crypto.news@mexc.com for removal. MEXC makes no guarantees regarding the accuracy, completeness, or timeliness of the content and is not responsible for any actions taken based on the information provided. The content does not constitute financial, legal, or other professional advice, nor should it be considered a recommendation or endorsement by MEXC.

You May Also Like

Navigating The Critical Geopolitical Risks And Hormuz Bottleneck – Rabobank Analysis

Navigating The Critical Geopolitical Risks And Hormuz Bottleneck – Rabobank Analysis

The post Navigating The Critical Geopolitical Risks And Hormuz Bottleneck – Rabobank Analysis appeared on BitcoinEthereumNews.com. Oil Market Alert: Navigating
Share
BitcoinEthereumNews2026/03/12 06:20
Crucial US Stock Market Update: What Wednesday’s Mixed Close Reveals

Crucial US Stock Market Update: What Wednesday’s Mixed Close Reveals

BitcoinWorld Crucial US Stock Market Update: What Wednesday’s Mixed Close Reveals The financial world often keeps us on our toes, and Wednesday was no exception. Investors watched closely as the US stock market concluded the day with a mixed performance across its major indexes. This snapshot offers a crucial glimpse into current investor sentiment and economic undercurrents, prompting many to ask: what exactly happened? Understanding the Latest US Stock Market Movements On Wednesday, the closing bell brought a varied picture for the US stock market. While some indexes celebrated gains, others registered slight declines, creating a truly mixed bag for investors. The Dow Jones Industrial Average showed resilience, climbing by a notable 0.57%. This positive movement suggests strength in some of the larger, more established companies. Conversely, the S&P 500, a broader benchmark often seen as a barometer for the overall market, experienced a modest dip of 0.1%. The technology-heavy Nasdaq Composite also saw a slight retreat, sliding by 0.33%. This particular index often reflects investor sentiment towards growth stocks and the tech sector. These divergent outcomes highlight the complex dynamics currently at play within the American economy. It’s not simply a matter of “up” or “down” for the entire US stock market; rather, it’s a nuanced landscape where different sectors and company types are responding to unique pressures and opportunities. Why Did the US Stock Market See Mixed Results? When the US stock market delivers a mixed performance, it often points to a tug-of-war between various economic factors. Several elements could have contributed to Wednesday’s varied closings. For instance, positive corporate earnings reports from certain industries might have bolstered the Dow. At the same time, concerns over inflation, interest rate policies by the Federal Reserve, or even global economic uncertainties could have pressured growth stocks, affecting the S&P 500 and Nasdaq. Key considerations often include: Economic Data: Recent reports on employment, manufacturing, or consumer spending can sway market sentiment. Corporate Announcements: Strong or weak earnings forecasts from influential companies can significantly impact their respective sectors. Interest Rate Expectations: The prospect of higher or lower interest rates directly influences borrowing costs for businesses and consumer spending, affecting future profitability. Geopolitical Events: Global tensions or trade policies can introduce uncertainty, causing investors to become more cautious. Understanding these underlying drivers is crucial for anyone trying to make sense of daily market fluctuations in the US stock market. Navigating Volatility in the US Stock Market A mixed close, while not a dramatic downturn, serves as a reminder that market volatility is a constant companion for investors. For those involved in the US stock market, particularly individuals managing their portfolios, these days underscore the importance of a well-thought-out strategy. It’s important not to react impulsively to daily movements. Instead, consider these actionable insights: Diversification: Spreading investments across different sectors and asset classes can help mitigate risk when one area underperforms. Long-Term Perspective: Focusing on long-term financial goals rather than short-term gains can help weather daily market swings. Stay Informed: Keeping abreast of economic news and company fundamentals provides context for market behavior. Consult Experts: Financial advisors can offer personalized guidance based on individual risk tolerance and objectives. Even small movements in major indexes can signal shifts that require attention, guiding future investment decisions within the dynamic US stock market. What’s Next for the US Stock Market? Looking ahead, investors will be keenly watching for further economic indicators and corporate announcements to gauge the direction of the US stock market. Upcoming inflation data, statements from the Federal Reserve, and quarterly earnings reports will likely provide more clarity. The interplay of these factors will continue to shape investor confidence and, consequently, the performance of the Dow, S&P 500, and Nasdaq. Remaining informed and adaptive will be key to understanding the market’s trajectory. Conclusion: Wednesday’s mixed close in the US stock market highlights the intricate balance of forces influencing financial markets. While the Dow showed strength, the S&P 500 and Nasdaq experienced slight declines, reflecting a nuanced economic landscape. This reminds us that understanding the ‘why’ behind these movements is as important as the movements themselves. As always, a thoughtful, informed approach remains the best strategy for navigating the complexities of the market. Frequently Asked Questions (FAQs) Q1: What does a “mixed close” mean for the US stock market? A1: A mixed close indicates that while some major stock indexes advanced, others declined. It suggests that different sectors or types of companies within the US stock market are experiencing varying influences, rather than a uniform market movement. Q2: Which major indexes were affected on Wednesday? A2: On Wednesday, the Dow Jones Industrial Average gained 0.57%, while the S&P 500 edged down 0.1%, and the Nasdaq Composite slid 0.33%, illustrating the mixed performance across the US stock market. Q3: What factors contribute to a mixed stock market performance? A3: Mixed performances in the US stock market can be influenced by various factors, including specific corporate earnings, economic data releases, shifts in interest rate expectations, and broader geopolitical events that affect different market segments uniquely. Q4: How should investors react to mixed market signals? A4: Investors are generally advised to maintain a long-term perspective, diversify their portfolios, stay informed about economic news, and avoid impulsive decisions. Consulting a financial advisor can also provide personalized guidance for navigating the US stock market. Q5: What indicators should investors watch for future US stock market trends? A5: Key indicators to watch include upcoming inflation reports, statements from the Federal Reserve regarding monetary policy, and quarterly corporate earnings reports. These will offer insights into the future direction of the US stock market. Did you find this analysis of the US stock market helpful? Share this article with your network on social media to help others understand the nuances of current financial trends! To learn more about the latest stock market trends, explore our article on key developments shaping the US stock market‘s future performance. This post Crucial US Stock Market Update: What Wednesday’s Mixed Close Reveals first appeared on BitcoinWorld.
Share
Coinstats2025/09/18 05:30
Is Binance’s CZ Really Richer than Bill Gates?

Is Binance’s CZ Really Richer than Bill Gates?

Changpeng Zhao ranked above Bill Gates on the 2026 Forbes billionaires list, but he says the figures are wrong.
Share
CryptoPotato2026/03/12 06:13