Zcash price today: where ZEC stands and what’s next
 Zcash price today sits in a constructive spot, with the market trying to digest a strong advance while sentiment across crypto remains fragile. In this article we look at how the daily and intraday indicators line up, and what they suggest about the next directional move for this privacy-focused asset.
 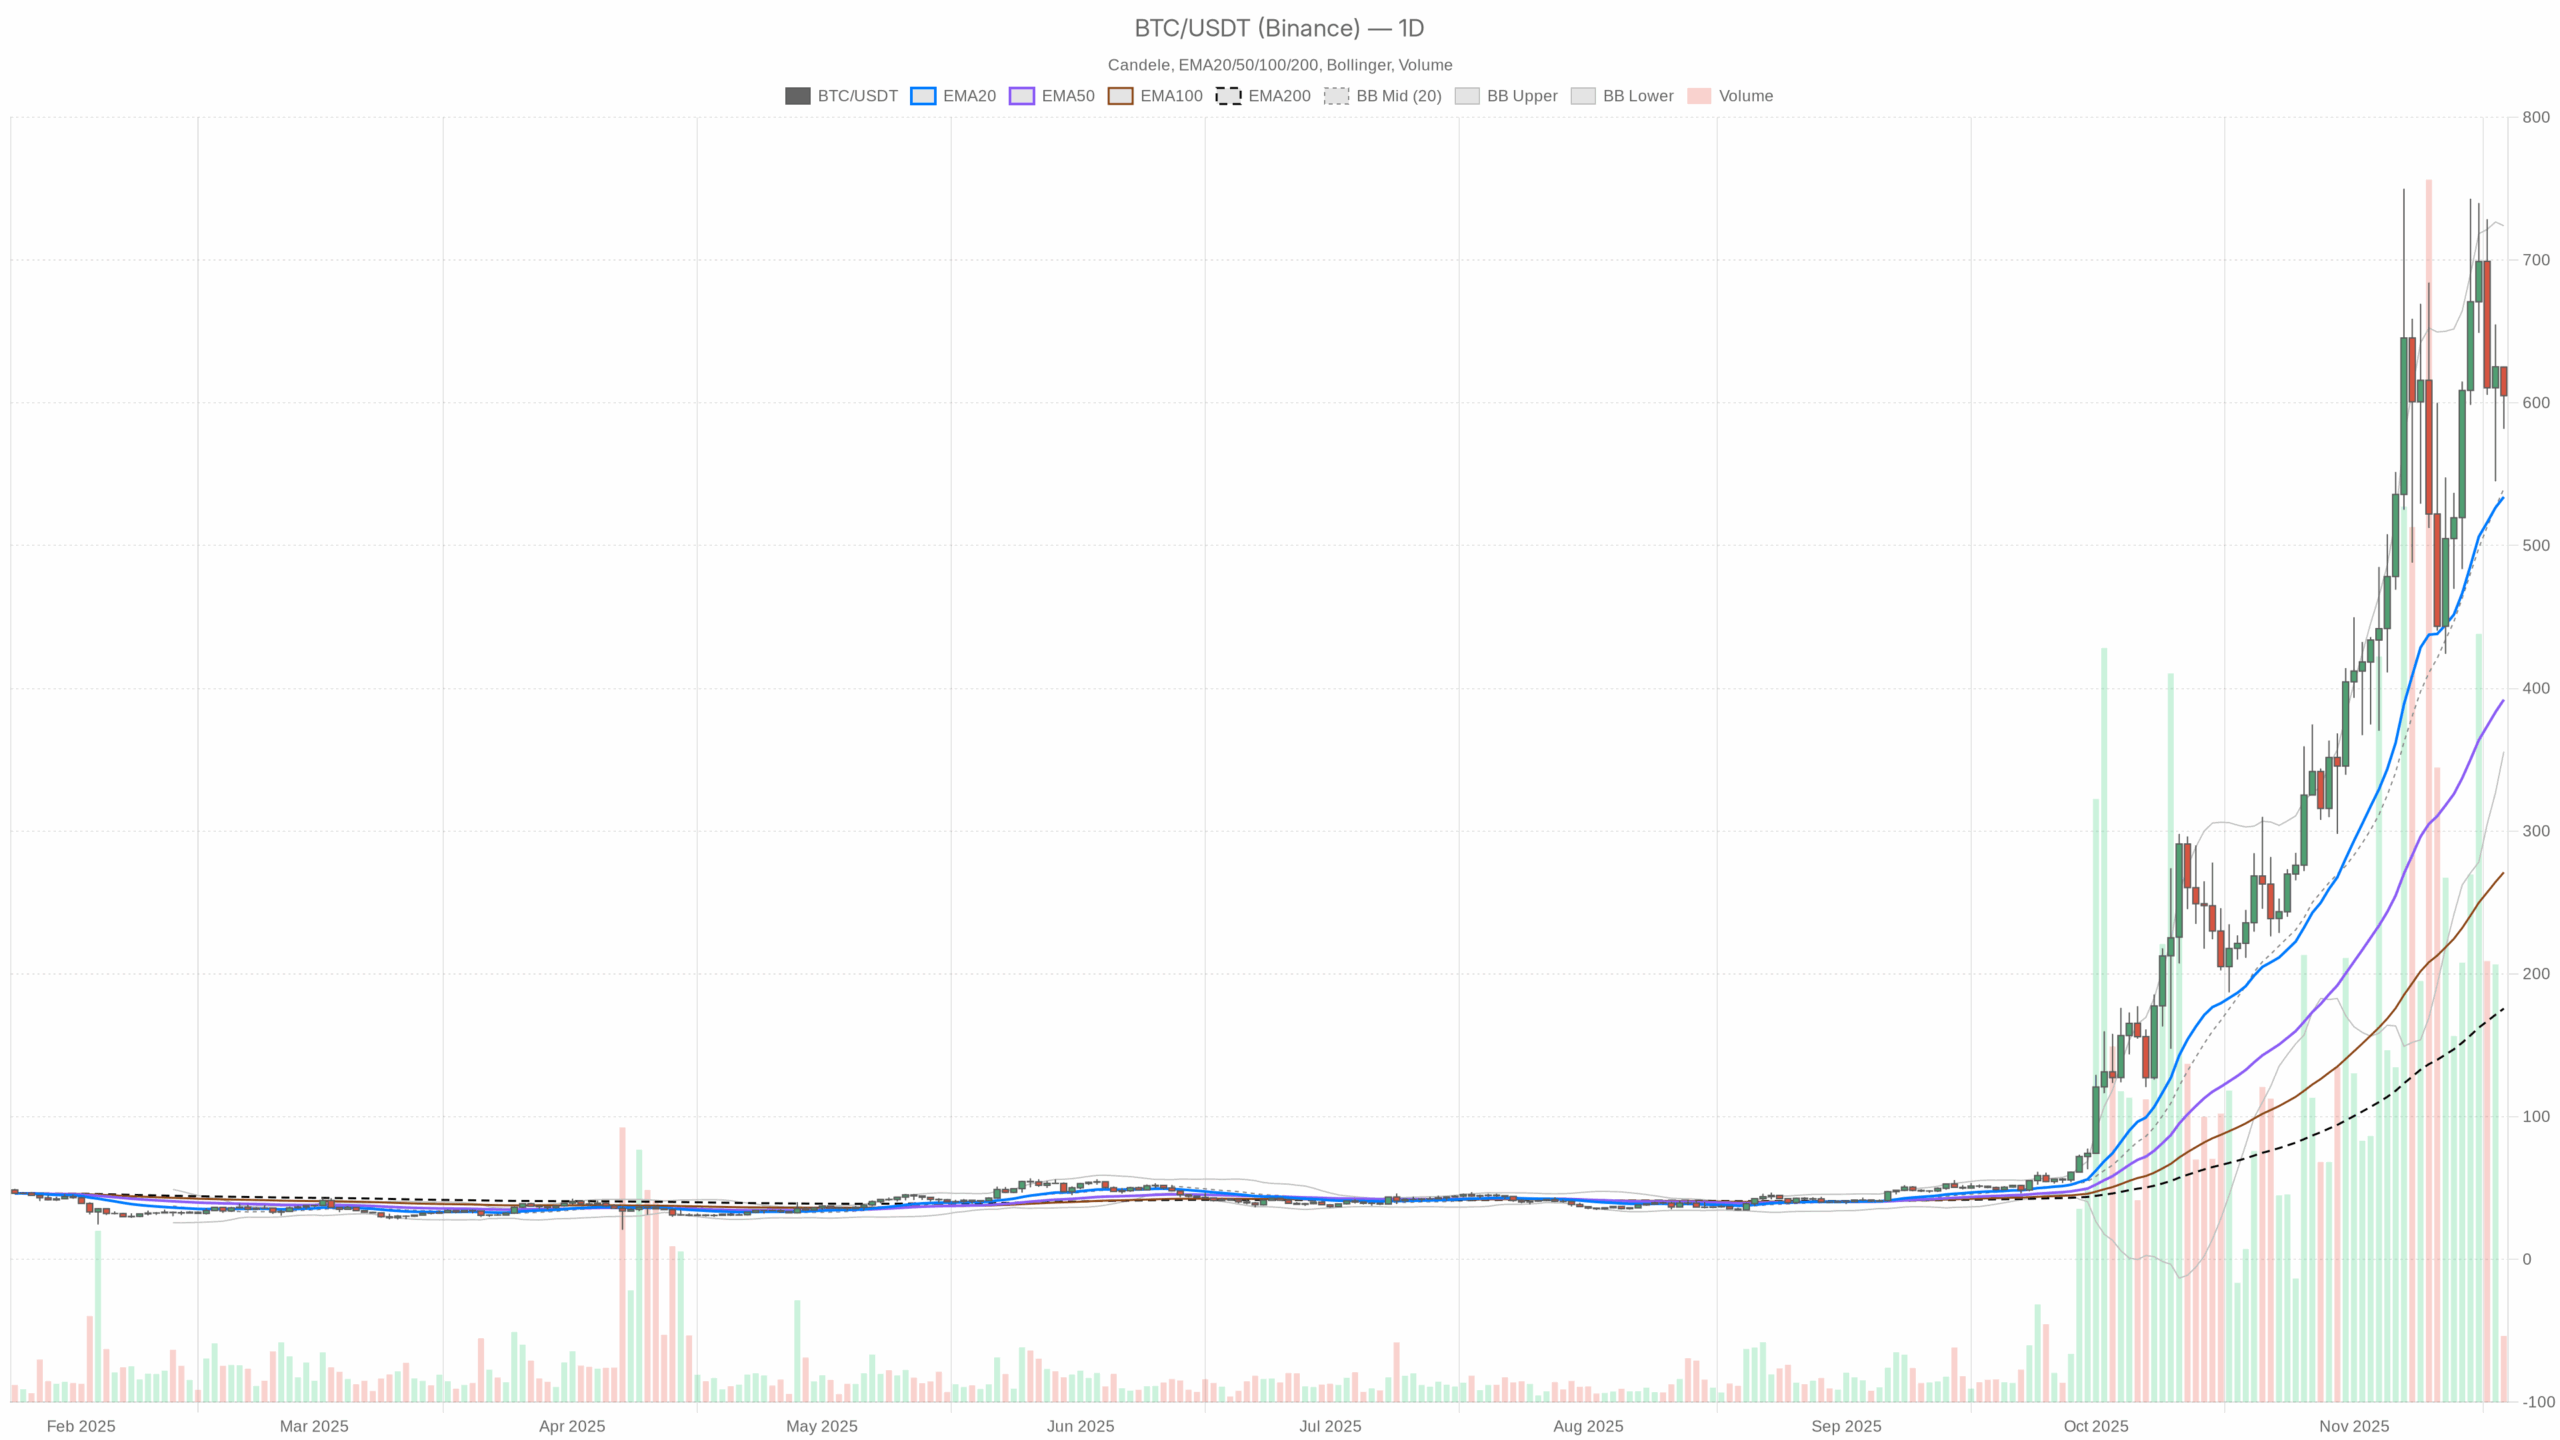 ZEC/USDT — daily chart with candlesticks, EMA20/EMA50 and volume.
Summary
The daily chart shows a clear bullish market regime, with price holding well above its key moving averages. Momentum is positive but not euphoric, as the daily RSI hovers in a healthy zone rather than in extreme overbought territory. Moreover, volatility remains elevated, hinting that sharp swings in either direction are still possible.
Pivot levels and Bollinger Bands cluster around the current area, suggesting an important decision point for traders. Meanwhile, the broader crypto market is growing modestly, even as overall sentiment skews to extreme fear. This contrast between constructive price action and nervous psychology may offer opportunities for disciplined participants.
Zcash price today: Market Context and Direction
On the macro side, total crypto market capitalization stands near 3.23 trillion dollars, up about 1.5% over the last 24 hours. Bitcoin dominance is high at roughly 56.7%, underscoring that large caps still drive the narrative while many alternative coins fight for attention. However, the Fear & Greed Index sits at 15, classified as Extreme Fear, meaning investors remain cautious and defensive despite rising prices.
For Zcash price, this backdrop today creates an interesting setup. The pair trades around 605, close to its daily pivot at 604.06, indicating the market is reassessing value after a strong run. Moreover, the asset is advancing in spite of fearful sentiment, a pattern that can sometimes mark the early stages of a more durable uptrend if it persists. That said, traders should still respect the possibility of abrupt shakeouts, especially with volatility heightened.
Technical Outlook: reading the overall setup
On the daily timeframe, the exponential moving averages line up in a classic trend confirmation structure. Price at 605.02 trades above the 20-day EMA at 534.1, the 50-day EMA at 392.09, and the 200-day EMA at 175.69. This wide separation between short-, medium-, and long-term averages reflects a strong underlying uptrend and shows that buyers have controlled the tape for weeks, if not months. It also means that even a pullback to the 20-day line would leave the broader structure intact.
The daily RSI at 60.44 supports this view. It sits above the neutral 50 zone but below the overbought threshold, implying constructive momentum without exhaustion. In practice, this suggests there is still room for further gains before the market risks a more aggressive mean reversion. However, if RSI were to roll back toward 50 while price stalls, it could warn that demand is fading.
The MACD on the daily chart is slightly more cautious. The MACD line is at 82.48 versus a signal line at 84.24, leaving a small negative histogram of -1.76. This mild crossover hints at momentum slowing rather than reversing. In other words, the trend is still up, but the pace of the advance is moderating as early buyers take some profits near current levels.
Bollinger Bands add another layer. With a mid-band around 539.82 and upper and lower bands at 724.01 and 355.63, price currently trades well above the mid-band but below the upper envelope. This positioning typically signals an ongoing advance within a wide volatility channel, where pullbacks to the middle band can act as dynamic support. As long as candles stay mostly in the upper half of this band structure, the path of least resistance leans higher.
The Average True Range on the daily chart comes in at 127.44, which is high relative to the absolute price. This reflects elevated volatility expansion, meaning intraday moves can be sizable compared to recent history. For traders, it argues for thoughtful position sizing and wider stops to avoid being shaken out by routine noise.
Intraday Perspective and ZEC crypto price Momentum today
On the hourly timeframe, the picture is more neutral. Price at 604.53 sits just below the 20-hour EMA at 606.14 and below the 50-hour EMA at 620.95, while hovering close to the 200-hour EMA at 607.41. This flattening and clustering of averages suggests short-term consolidation after the prior surge, rather than an outright breakdown.
Meanwhile, the hourly RSI at 48.08 is essentially neutral, implying that neither bulls nor bears dominate over the very short term. The hourly MACD line at -5.96 with a small negative histogram of -0.34 likewise points to muted intraday momentum. As a result, the shorter timeframe appears to be digesting gains made on the daily chart, which is a typical pause pattern inside a broader uptrend.
The 15-minute chart echoes this stance but with a slight bullish lean. Price at 604.15 is above the 20-period EMA at 598.71 and almost aligned with the 50-period EMA at 604.28, while still under the 200-period EMA at 624.1. The 15-minute RSI at 53.55 nudges above neutral, and the MACD histogram is marginally positive. Together, these signals hint at attempts by short-term traders to reassert upside momentum, even if a decisive breakout has yet to materialize.
Key Levels and Market Reactions
On the daily chart, price trades almost exactly at the main pivot of 604.06. Just below, initial support emerges near 582.7, the first area where dip buyers may attempt to defend the trend. If price were to slip through this zone on strong volume, it would indicate that short-term supply is gaining the upper hand, potentially opening a move toward the middle Bollinger Band around 540.
On the upside, the first important resistance sits close to 626.39. A firm push through this area, particularly if accompanied by a fresh acceleration in momentum, would signal that bulls are ready to extend the advance toward the upper Bollinger Band near 724. Conversely, repeated failures around this cluster could encourage range trading, with the market oscillating between roughly 580 and 630 while it builds a new base.
Future Scenarios and Investment Outlook
Overall, Zcash price today points to an asset in an established uptrend that is temporarily catching its breath. The wide separation of daily EMAs and a healthy RSI backdrop argue that the medium-term bias remains higher as long as price holds above the 20-day moving average region. However, the softening MACD and high ATR remind us that this path is unlikely to be smooth, with spikes in volatility capable of shaking out overleveraged positions.
For investors with a longer horizon, gradual scaling strategies and attention to pullbacks toward key supports may be more appropriate than chasing short-lived intraday spikes. Short-term traders, by contrast, will likely focus on how price behaves around the intraday moving averages and the 626 area to gauge whether a new breakout setup is forming or whether a deeper consolidation is in store. In all cases, aligning position size with the current volatility regime is crucial.
This analysis is for informational purposes only and does not constitute financial advice.
Readers should conduct their own research before making investment decisions.
You May Also Like

CEO Sandeep Nailwal Shared Highlights About RWA on Polygon

Velo protocol Integrates SumPlus to Power AI-Driven Finance