

Nearly 7M Bitcoin Now Sitting At A Loss: Highest Unrealized Pain Since January 2024
Bitcoin is now holding ground around the $90K level as the market transitions into a new and uncertain phase. Sentiment is sharply divided: some analysts argue that the breakdown below $100K marks the beginning of a new bear market, while others believe Bitcoin is setting the stage to break its traditional four-year cycle and rally harder than ever in the months ahead. This tension reflects a market struggling to price in fear, macro pressure, and structural shifts in liquidity.
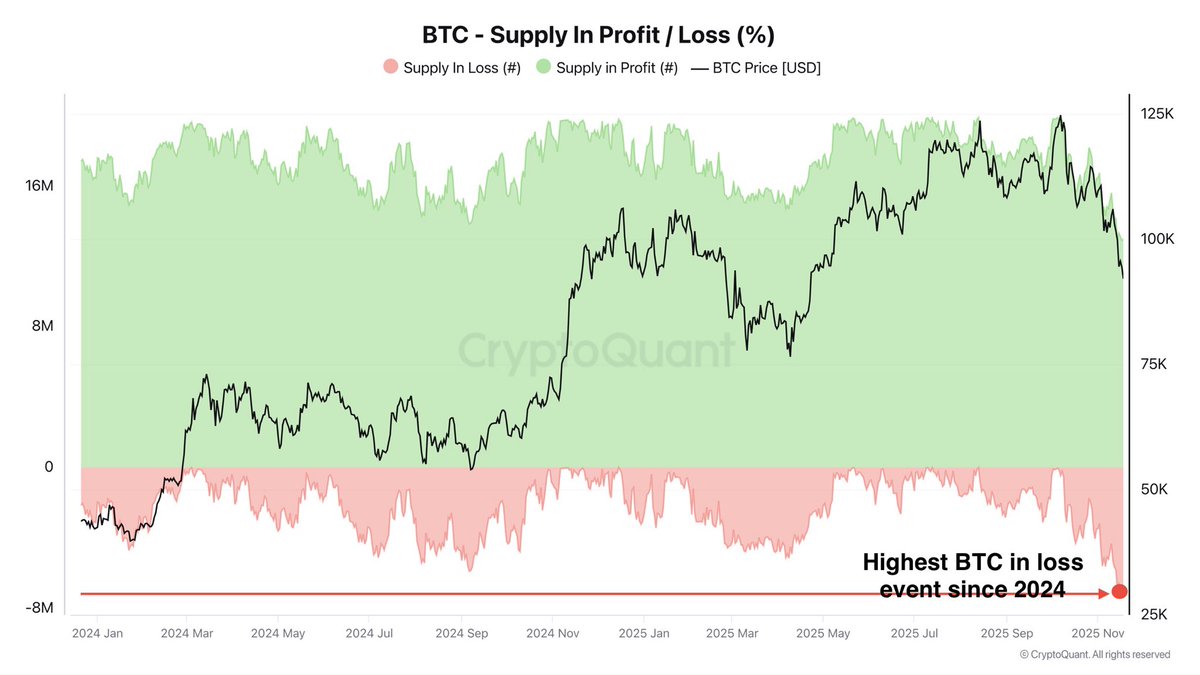
According to new data shared by top analyst Darkfost, more than 6.96 million BTC accumulated by investors are now sitting at an unrealized loss. This marks the highest level of unrealized loss since January 2024, even though the current correction has not yet surpassed the steepest drawdown seen earlier in the cycle. The implication is clear: a massive portion of supply was accumulated near Bitcoin’s previous all-time highs, making recent selling pressure especially emotional and reactive.
Despite this, Bitcoin continues to defend the $90K region — a sign that demand is absorbing extreme stress. Whether this marks the early stage of a bear market or the final flush before a major rebound remains the central question dominating the market.
Rising Unrealized Losses Signal a Classic “Change of Hands” Phase
Darkfost explains that the spike in unrealized losses reflects a simple but critical reality: a massive amount of Bitcoin was accumulated near the previous all-time highs, meaning many recent buyers are now underwater. This is especially true for short-term holders (STHs), who tend to react quickly to volatility. Their elevated cost basis — clustered near cycle tops — makes them more vulnerable to panic selling, which is exactly what the market is witnessing as BTC hovers near $90K.
This phenomenon helps explain the intense selling pressure seen in recent days. STHs, driven by fear and deteriorating sentiment, have been sending coins to exchanges at a loss, amplifying short-term volatility. But Darkfost notes an important historical pattern: during bullish market structures, rising unrealized losses have consistently produced strong buying opportunities.
These phases often mark the transition where weak hands capitulate and long-term, conviction-driven buyers absorb supply. This is the defining moment of the “change of hands” narrative — where Bitcoin shifts from emotionally driven participants to strategic holders who shape the next major move.
BTC Price Analysis: Testing Major Support as Momentum Weakens
Bitcoin continues to trade under heavy pressure, holding just above the critical $90K region after a sharp multi-week decline. The 3-day chart shows a decisive break below the 50-day and 100-day moving averages, signaling a loss of short- and medium-term momentum. Price is now sitting directly on the 200-day moving average — a level that historically acts as the final line of defense during deep corrections in bullish cycles.

The recent candles show long lower wicks, suggesting buyers are attempting to defend this zone, but the rebound strength remains limited. Volume has increased on downside moves, confirming that sellers are driving the current structure. This pattern resembles previous late-cycle shakeouts, where high volatility clusters near major moving averages precede a trend reset or further breakdown.
Structurally, BTC is forming lower highs and lower lows on this timeframe — a clear sign of short-term bearish conditions. A sustained break below the 200-day MA could accelerate downside momentum and expose lower liquidity pockets around $85K–$88K.
However, if bulls manage to stabilize the price above $90K and reclaim the 100-day MA in the coming sessions, it could signal seller exhaustion. Right now, Bitcoin sits at a pivotal crossroads, with market sentiment fragile and direction dependent on how this support zone holds.
Featured image from ChatGPT, chart from TradingView.com


You May Also Like

Arbitrum Announces Ten Innovative Teams — And Why It’s Not Just Hype

Cathie Wood’s ARK Invest Buys $13.7M in Circle Shares While Selling Robinhood Stock

The changing face of elder care in Malaysia — Sayed Mohammad Reza Yamani Sayed Umar


