

Pendle (PENDLE) Price Prediction 2025, 2026-2030
- Bullish PENDLE price prediction for 2025 is $4.736 to $7.561.
- Pendle (PENDLE) price might reach $15 soon.
- Bearish PENDLE price prediction for 2025 is $1.936.
In this Pendle (PENDLE) price prediction 2025, 2026-2030, we will analyze the price patterns of PENDLE by using accurate trader-friendly technical analysis indicators and predict the future movement of the cryptocurrency.
|
TABLE OF CONTENTS
|
|
INTRODUCTION
|
|
|
Pendle (PENDLE) PRICE PREDICTION 2025
|
|
| Pendle (PENDLE) PRICE PREDICTION 2026, 2027-2030 |
| CONCLUSION |
| FAQ |
Pendle (PENDLE) Current Market Status
| Current Price | $2.27 |
| 24 – Hour Price Change | 1.23% Down |
| 24 – Hour Trading Volume | $51.37M |
| Market Cap | $376.5M |
| Circulating Supply | 165.15M PENDLE |
| All – Time High | $7.52 (On April 11, 2024) |
| All – Time Low | $0.03349 (On Nov 10, 2022) |
What is Pendle (PENDLE)
| TICKER | PENDLE |
| BLOCKCHAIN | Ethereum Blockchain |
| CATEGORY | DeFi Protocol |
| LAUNCHED ON | June 2021 |
| UTILITIES | Governance, yield trading, Staking & rewards |
Pendle Finance is a yield tokenization protocol on Ethereum. The platform provides users the opportunity to speculate and hedge future yields. PENDLE is the native token of Pendle Finance . It is used for governance, to tokenize yields and ownerships and liquidity.
Pendle Finance was founded in 2021 by a pseudo-anonymous team known as TN lee, GT, YK, and Vu. The platform recently witnessed a security breach on its Penpie yield optimization tool within the ecosystem. The firm later announced that it safeguarded the funds after the attack.
Pendle 24H Technicals
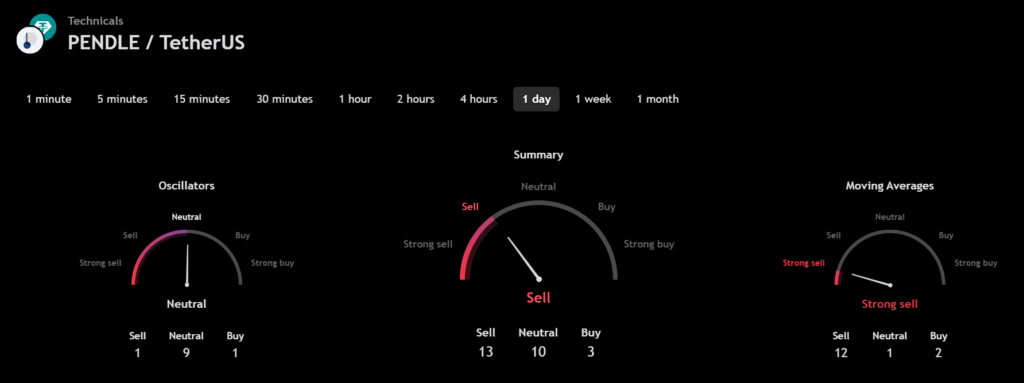 (Source: TradingView)
Pendle (PENDLE) Price Prediction 2025
Pendle (PENDLE) ranks 119th on CoinMarketCap in terms of its market capitalization. The overview of the Pendle price prediction for 2025 is explained below with a daily time frame.
In the above chart, Pendle (PENDLE) laid out an Horizontal channel pattern. The Horizontal channel pattern is also known as the sideways trend. In general, the horizontal channel is formed during the price consolidation. In this pattern, the upper trendline, the line that connects the highs, and the lower trendline, the line that connects the lows, run horizontally parallel, and the price action is contained within it.
A horizontal channel is often regarded as one of the suitable patterns for timing the market, as the buying and selling points are in consolidation.
At the time of analysis, the price of Pendle (PENDLE) was recorded at $2.27 If the pattern trend continues, then the price of PENDLE might reach the resistance levels of $3.588, and $4.375. If the trend reverses, then the price of PENDLE may fall to the support levels of $3.241 and $2.935.
Pendle (PENDLE) Resistance and Support Levels
The chart given below elucidates the possible resistance and support levels of Pendle (PENDLE) in 2025.
From the above chart, we can analyze and identify the following as resistance and support levels of Pendle (PENDLE) for 2025.
| Resistance Level 1 | $4.736 |
| Resistance Level 2 | $7.561 |
| Support Level 1 | $3.084 |
| Support Level 2 | $1.936 |
PENDLE Resistance & Support Levels
Pendle (PENDLE) Price Prediction 2025 — RVOL, MA, and RSI
The technical analysis indicators, such as Relative Volume (RVOL), Moving Average (MA), and Relative Strength Index (RSI) of Pendle (PENDLE) are shown in the chart below.
From the readings on the chart above, we can make the following inferences regarding the current Pendle (PENDLE) market in 2025.
| INDICATOR | PURPOSE | READING | INFERENCE |
| 50-Day Moving Average (50MA) | Nature of the current trend by comparing the average price over 50 days | 50 MA = $4.316Price = $3.536 (50MA > Price) |
Bullish/Uptrend |
| Relative Strength Index (RSI) | Magnitude of price change;Analyzing oversold & overbought conditions | 45.522 <30 = Oversold 50-70 = Neutral>70 = Overbought |
Nearly Oversold |
| Relative Volume (RVOL) | Asset’s trading volume in relation to its recent average volumes | Below cutoff line | Weak volume |
Pendle (PENDLE) Price Prediction 2025 — ADX, RVI
In the below chart, we analyze the strength and volatility of Pendle (PENDLE) using the following technical analysis indicators — Average Directional Index (ADX) and Relative Volatility Index (RVI).
From the readings on the chart above, we can make the following inferences regarding the price momentum of Pendle (PENDLE).
| INDICATOR | PURPOSE | READING | INFERENCE |
| Average Directional Index (ADX) | Strength of the trend momentum | 63.612 | Strong Trend |
| Relative Volatility Index (RVI) | Volatility over a specific period | 32.94 <50 = Low >50 = High |
Low Volatility |
Comparison of PENDLE with BTC, ETH
Let us now compare the price movements of Pendle (PENDLE) with that of Bitcoin (BTC), and Ethereum (ETH).
BTC Vs ETH Vs PENDLE Price Comparison (Source: TradingView)
From the above chart, we can interpret that the price action of PENDLE is similar to that of BTC and ETH. That is, when the price of BTC and ETH increases or decreases, the price of PENDLE also increases or decreases, respectively.
Pendle (PENDLE) Price Prediction 2026, 2027 – 2030
With the help of the aforementioned technical analysis indicators and trend patterns, let us predict the price of Pendle (PENDLE) in 2026, 2027, 2028, 2029, and 2030.
| Year | Bullish Price | Bearish Price |
| Pendle (PENDLE) Price Prediction 2026 | $20 | $1 |
| Pendle (PENDLE) Price Prediction 2027 | $25 | $0.9 |
| Pendle (PENDLE) Price Prediction 2028 | $30 | $0.8 |
| Pendle (PENDLE) Price Prediction 2029 | $35 | $0.7 |
| Pendle (PENDLE) Price Prediction 2030 | $40 | $0.6 |
Conclusion
If Pendle (PENDLE) establishes itself as a good investment in 2025, this year will be favorable to the cryptocurrency. In conclusion, the bullish Pendle (PENDLE) price prediction for 2025 is $7.561. Comparatively, if an unfavorable sentiment is triggered, the bearish Pendle (PENDLE) price prediction for 2025 is $1.936.
If the market momentum and investors’ sentiments elevate positively, Pendle (PENDLE) might hit $15. Furthermore, with future upgrades and advancements in the Pendle ecosystem, PENDLE might surpass its current all-time high (ATH) of $7.52 and mark its new ATH.
FAQ
1. What is Pendle (PENDLE)?
Pendle is a protocol situated within the decentralized finance (DeFi) ecosystem, focusing on the innovative concept of tokenizing and trading future yield.
2. Where can you purchase Pendle (PENDLE)?
Traders can trade Pendle (PENDLE) on the following cryptocurrency exchanges such as KuCoin, Binance, CoinEx, Kraken, OKX, and Bybit.
3. Will Pendle (PENDLE) reach a new ATH soon?
With the ongoing developments and upgrades within the Pendle platform, Pendle (PENDLE) has a high possibility of reaching its ATH soon.
4. What is the current all-time high (ATH) of Pendle (PENDLE)?
Pendle (PENDLE) hit its current all-time high (ATH) of $7.52 on Apr 11, 2024.
5. What is the lowest price of Pendle (PENDLE)?
According to CoinMarketCap, PENDLE hit its all-time low (ATL) of $0.03349 on Nov 10, 2022.
6. Will Pendle (PENDLE) reach $15?
If Pendle (PENDLE) becomes one of the active cryptocurrencies that majorly maintain a bullish trend, it might rally to hit $15 soon.
7. What will be Pendle (PENDLE) price by 2026?
Pendle (PENDLE) price is expected to reach $20 by 2026.
8. What will be Pendle (PENDLE) price by 2027?
Pendle (PENDLE) price is expected to reach $25 by 2027.
9. What will be Pendle (PENDLE) price by 2028?
Pendle (PENDLE) price is expected to reach $30 by 2028.
10. What will be Pendle (PENDLE) price by 2029?
Pendle (PENDLE) price is expected to reach $35 by 2029.
Top Crypto Predictions
Notcoin (NOT) Price Prediction
FLOKI (FLOKI) Price Prediction
Chainlink (LINK) Price Prediction
Disclaimer: The opinion expressed in this chart is solely the author’s. It does not represent any investment advice. TheNewsCrypto team encourages all to do their own research before investing.


You May Also Like

Strategy’s High-Yield Stock Will Continue to Fuel Bitcoin Surge, Says Bitwise CIO

WTI Hovers Around $97.00: US Iran Blockade Extension Sparks Supply Fears


