

Data Rings Alarm: Bitcoin Hits 2-Year Bearish Extreme — Historically Bullish?
According to CryptoQuant data, Bitcoin has moved into what analysts are calling the most bearish phase of the last two years, sending prices down sharply and weighing on the broader crypto market.
The coin slid from a peak above $126,000 on Oct. 6 to $83,790, a drop of around 34% that erased roughly $715 billion in market value.
Bull Conditions Have Weakened Rapidly
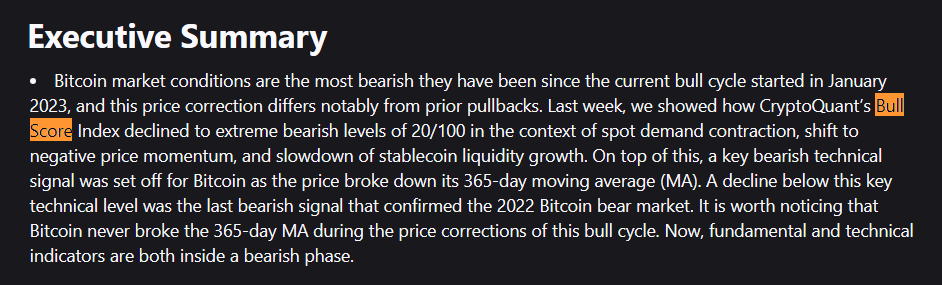
Reports have disclosed that CryptoQuant’s Bull Score Index fell to 20 out of 100 last week, driven by weak spot buying, negative price momentum, and a slowdown in stablecoin liquidity.
Bitcoin also closed below its 365-day moving average, a long-run trendline that had held during earlier pullbacks in the current cycle that began in January 2023.
Based on these signs, CryptoQuant views the market as clearly more bearish than it was in prior corrections.
Trading desks and corporate treasuries have shifted behavior. Treasury companies that once supported prices have seen market values drop by 70% to more than 90% in recent months, limiting their ability to issue shares and buy more Bitcoin.
Reports show Michael Saylor’s Strategy bought 8,178 BTC earlier this week but has slowed purchases as its stock market cap fell closer to the value of its holdings.
ETF flows have also turned negative, with outflows totaling close to $3 billion so far this month, a dynamic that can force some institutions to sell spot holdings if spread trades are unwound.
Technical Levels And Short-Term Signals
Based on on-chain indicators, there are mixed signals for buyers. Glassnode reported the Mayer Multiple moving toward the bottom of its long-term range, which often signals a value-driven phase where buyers re-enter.
Some technical traders see oversold readings on daily and weekly RSI, a setup that could allow a bounce. Some analysts expect at least a short-term recovery, with price tests above $100,000 possible if buying returns.
Still, the breakdown under the 365-day average changes the picture. CryptoQuant suggested resistance near $102,600 could prove heavy, and the support band between $90,000 and $92,000 will be closely watched.
Historically, Bitcoin has produced rallies of 40% to 50% inside broader downtrends, so rapid reversals are not out of the question even in a bearish phase.
Based on reports, the sharp sell-off that triggered the recent crash began on October 10 when a large leverage flush-out forced many positions to close.
Market makers reduced liquidity and selling pressure intensified. A software fault tied to the Athena USDE stablecoin on Binance briefly pushed its peg to $0.65, triggering automated liquidations across platforms and accelerating losses.
Macro worries, including tighter liquidity and political uncertainty, added pressure and sent more traders to the exits.
Some observers have linked parts of the 2024 and 2025 rallies to specific events. In 2024, US President Donald Trump’s election was one factor cited for pushing BTC above $100,000, and in 2025, a wave of corporate treasuries bought Bitcoin, helping lift prices above $120,000 in summer months.
According to CryptoQuant, those catalysts have largely played out, and any new triggers may be priced in already.
Featured image from Unsplash, chart from TradingView


You May Also Like

Data focus shifts to payrolls – Societe Generale

Not a loophole: Singapore AI export controls let China tap US AI legally

Q2 Market Insights: Bitcoin regains dominance in risk-averse environment, ETFs remain critical to market structure


