Aster crypto outlook: is ASTERUSDT nearing a turning point?
 Aster crypto is trading in a fragile balance, with price action hinting at stabilization but not yet a convincing rebound. In this piece we explore how the daily and intraday structure line up, what key levels matter, and how broader crypto sentiment could shape the next directional move.
 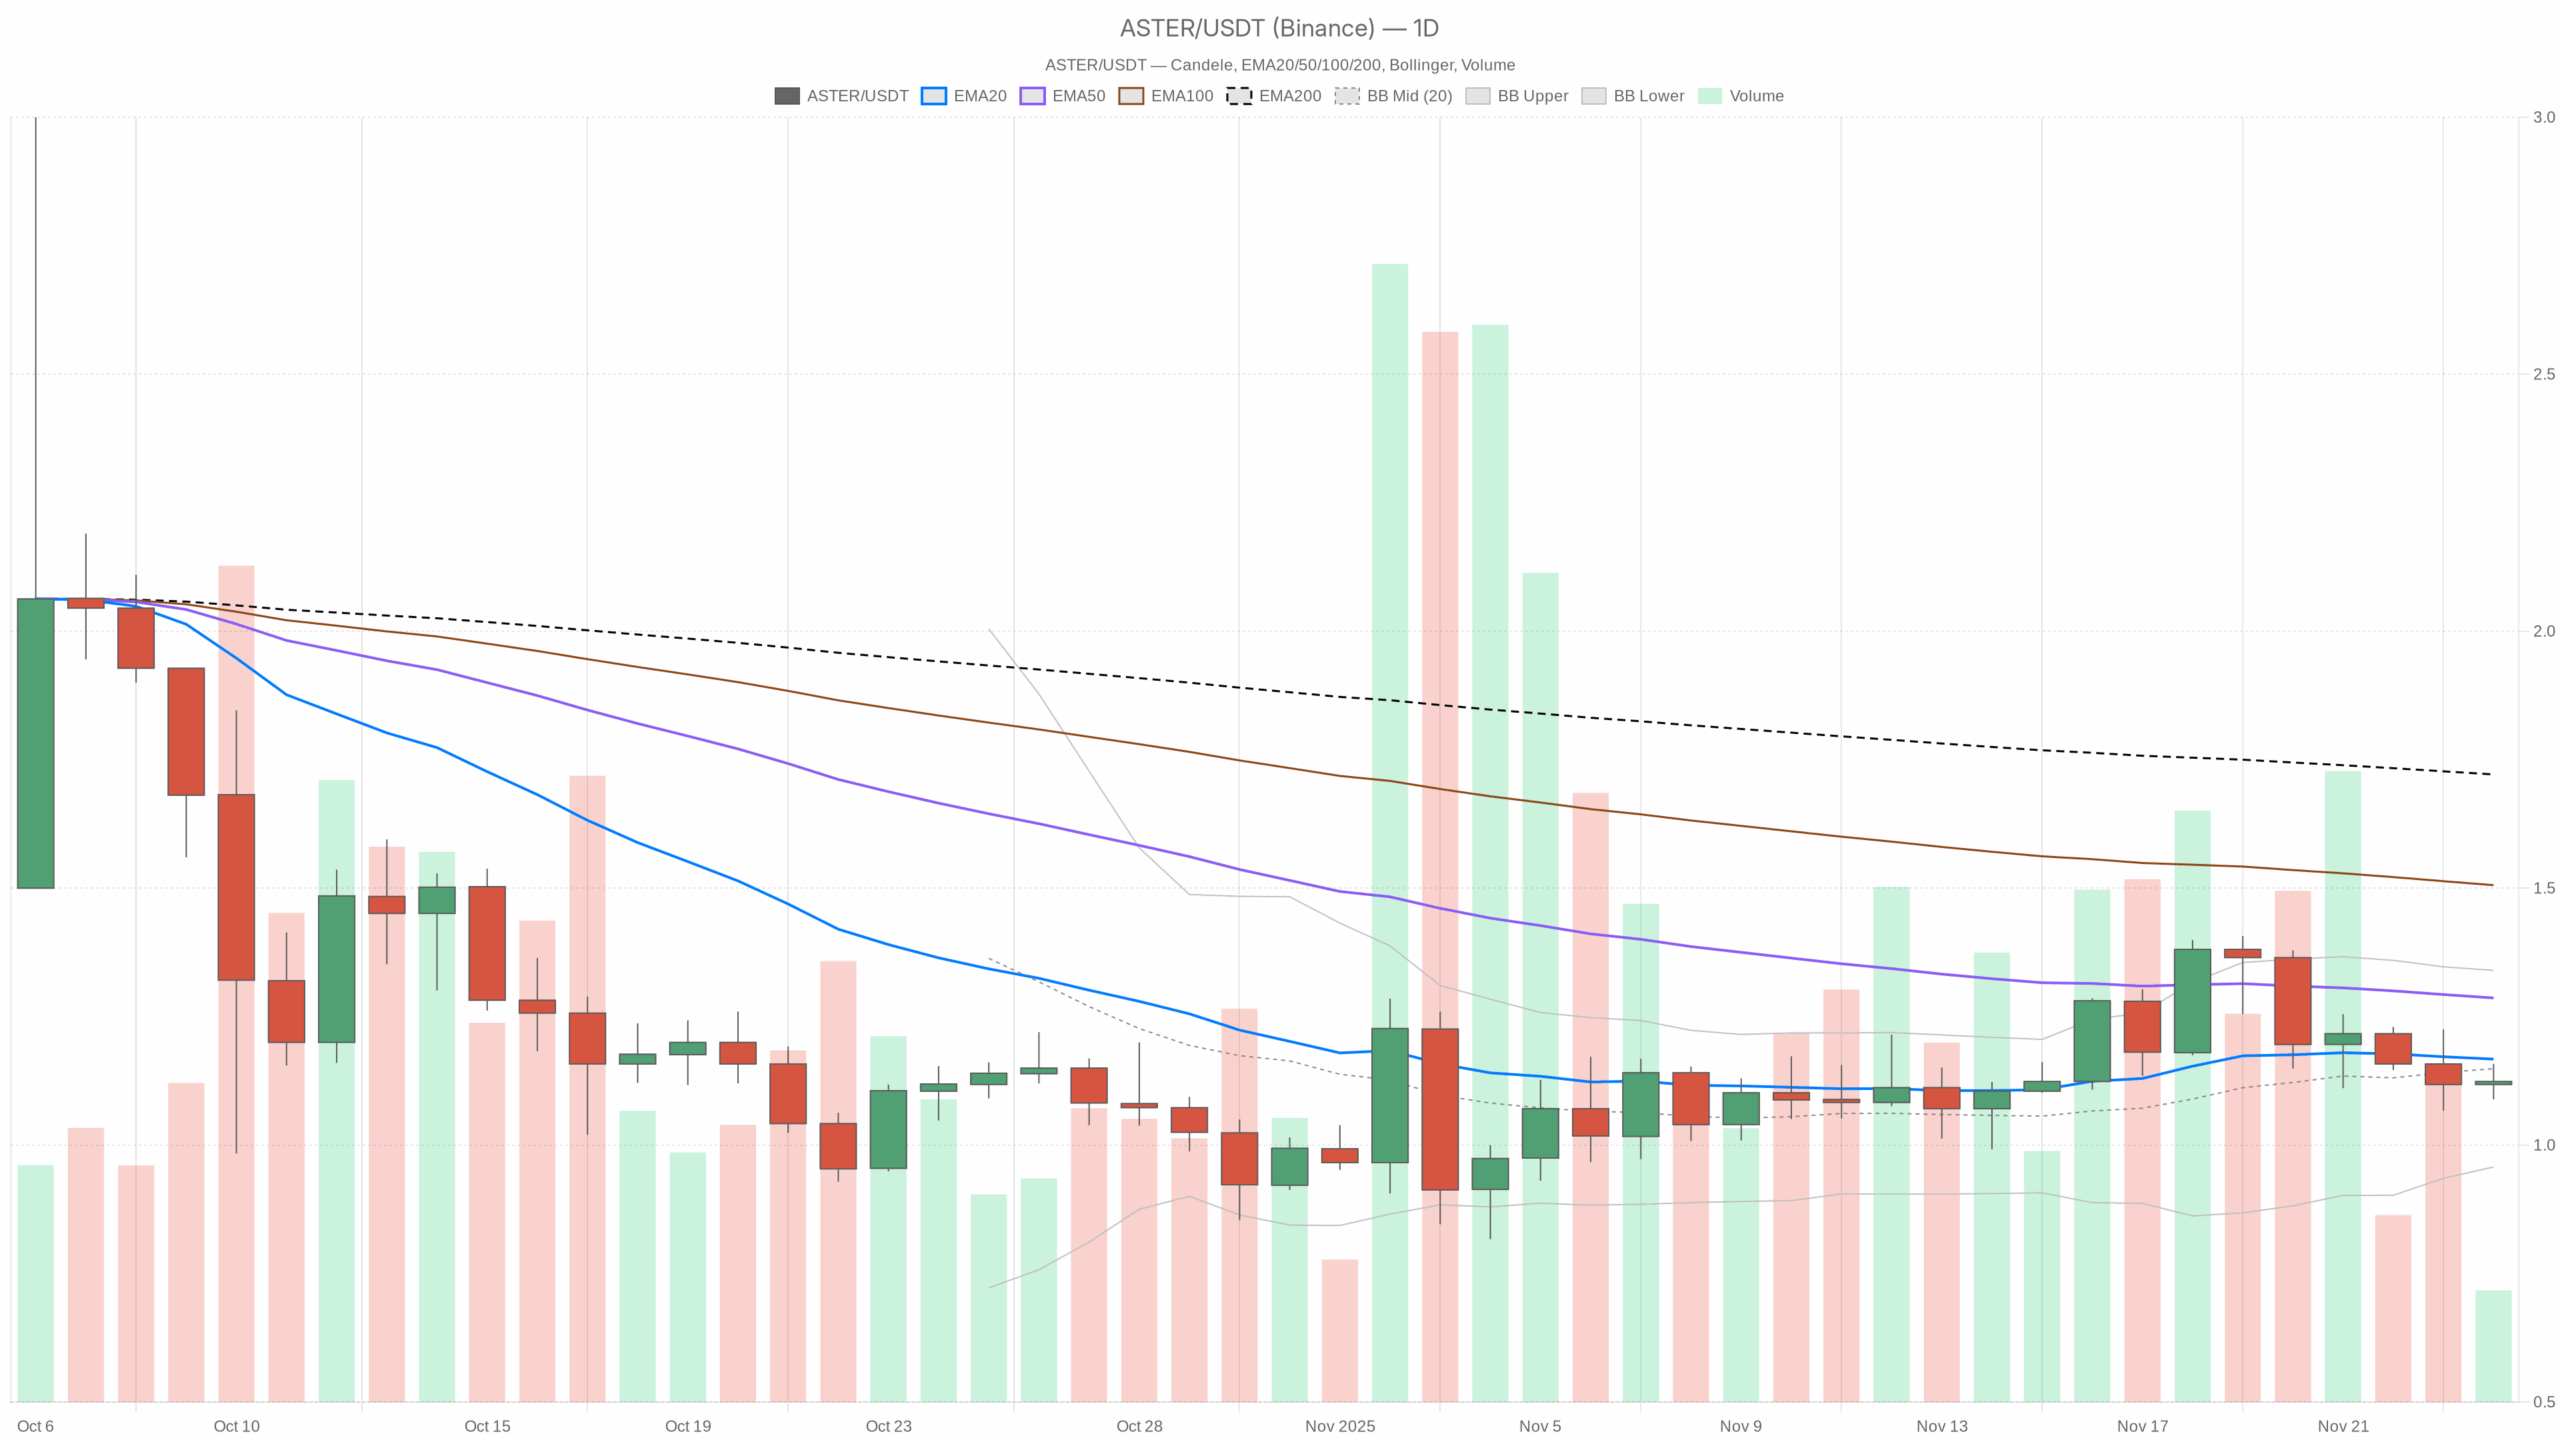 ASTER/USDT — daily chart with candlesticks, EMA20/EMA50 and volume.
Summary
The token changes hands around 1.12 USDT, almost exactly at its daily pivot, suggesting a market pausing to reassess. The daily trend backdrop remains bearish, with price lingering below all key exponential moving averages. However, momentum indicators look more neutral than aggressive, pointing to a potential consolidation phase rather than a sharp breakdown. Volatility on the daily chart is moderate, while intraday readings show compressed ranges that often precede larger swings. Broader crypto capitalization is slightly up on the day, but sentiment sits in Extreme Fear, reflecting cautious positioning. Overall, participants appear defensive, yet not in full capitulation.
Aster crypto: Market Context and Direction
The macro environment for digital assets is relatively constructive, with total crypto market capitalization hovering around $3.04 trillion and rising about 0.6% over the last 24 hours. Moreover, Bitcoin dominates roughly 57% of market cap, indicating that capital is clustered in the most established coin rather than rotating aggressively into altcoins. That tends to keep smaller tokens in a more fragile position, as liquidity concentrates elsewhere.
The Fear & Greed Index at 19 (Extreme Fear) adds an important psychological layer: investors are risk-averse and quick to take profits or cut losses. In contrast to bull phases, when speculative capital spills into smaller names, this backdrop favors capital preservation. That said, extreme fear is often associated with late-stage selling pressure, which can precede medium-term bottoms if price behavior starts to stabilize, as this asset is beginning to do around its pivot.
Technical Outlook: reading the overall setup
On the daily timeframe, the token trades at 1.12, beneath the 20-day EMA at 1.17, the 50-day at 1.29, and the 200-day at 1.72. This clear alignment of EMAs above price confirms a dominant bearish trend structure, where rallies are still technically countertrend. Until price can reclaim at least the shortest moving average, medium-term sellers keep the upper hand.
The RSI at 45.67 sits just below the midpoint, signaling neither overbought nor oversold conditions. This points to momentum exhaustion on the downside rather than aggressive selling, which fits with a pause within an ongoing downtrend. It suggests that bears are less dominant than before, but buyers have not yet demonstrated strong conviction.
MACD on the daily chart is marginally positive, with the line at 0 and the signal at -0.01, producing a small positive histogram of 0.01. This subtle configuration hints at a tentative bullish momentum crossover attempt, but the magnitude is too small to speak of a confirmed shift. It instead reflects a market that is trying to transition from pure decline to sideways repair.
Bollinger Bands reinforce this reading. With the mid-band at 1.15 and price at 1.12, the token trades slightly below the center of a range stretching from 0.96 to 1.34. The distance between bands is not extreme, indicating no dramatic volatility expansion yet. As a result, the setup favors continued consolidation with occasional tests toward either band, rather than a runaway trend in the very short term.
The daily ATR around 0.14 highlights moderate average daily movement. This level of volatility can still punish overleveraged positions, but it does not scream panic. Instead, it underlines a phase where two-sided trading is possible, allowing both dip buyers and short-term sellers to act around clearly defined levels.
Intraday Perspective and ASTERUSDT token Momentum
On the hourly chart, price sits again at 1.12, with the 20, 50, and 200-hour EMAs grouped between 1.13 and 1.19. This tight clustering above price reflects a modest, ongoing intraday downtrend but also a flattening of momentum. Meanwhile, the RSI on this timeframe is close to 48, mirroring the neutral stance seen on the daily chart.
The hourly MACD is effectively flat, with line and signal both around -0.01 and a zero histogram, confirming the absence of a strong directional push. Bollinger Bands on H1 are narrow, from 1.08 to 1.15, and ATR sits near 0.02, signaling suppressed intraday volatility. As a result, short-term traders are operating within compressed ranges that often precede a more decisive breakout, up or down, once new catalysts emerge.
On the 15-minute chart, the picture is similar: price hovers around 1.12, the EMAs are almost stacked on top of each other, and regime is labeled neutral. This reinforces the idea of a market catching its breath after prior declines, with no clear intraday edge beyond range trading.
Key Levels and Market Reactions
From a tactical viewpoint, the daily pivot at 1.12 is the central battleground. As long as price oscillates around this level, traders will likely treat the environment as a short-term range. A move toward the first resistance area near 1.16 would test whether sellers are ready to defend the nearest overhead supply; a sustained break above it could open room toward the Bollinger mid-band around 1.15–1.17 and, later, the 20-day EMA.
On the downside, the nearest support band sits just under 1.10, around the first support pivot at 1.09. A clean rejection from this zone would confirm dip buying interest and support the case for ongoing consolidation. Conversely, a decisive close below 1.09, especially accompanied by rising ATR and an RSI push below 40, would signal renewed bearish pressure and could drag the token toward the lower Bollinger Band near 0.96.
Future Scenarios and Investment Outlook
Overall, the balance of evidence points to a prevailing downtrend that is attempting to stabilize rather than reverse. The combination of a bearish EMA stack, neutral RSI, and subdued MACD suggests a base-building or pause phase, not yet a confirmed trend change. With crypto-wide sentiment stuck in Extreme Fear and Bitcoin commanding the lion’s share of attention, this asset may continue to lag until risk appetite improves.
For investors, this backdrop argues for patience and selectivity. Trend followers will likely wait for clear trend confirmation, such as a sustained break above the 20-day EMA with strengthening momentum. Meanwhile, range traders may find opportunities by leaning against the 1.09–1.16 band, keeping tight risk controls in case volatility suddenly expands. Until broader sentiment turns and technicals align more constructively, the path of least resistance remains mildly downward, punctuated by short-lived rebounds rather than sustained rallies.
This analysis is for informational purposes only and does not constitute financial advice.
Readers should conduct their own research before making investment decisions.
You May Also Like

Stablecoins Are Taking Over TradFi: Inside Ripple’s Massive 2026 Industry Survey

“Trusted the wrong people”—Hawk Tuah Denies Role in HAWK Token Collapse