Binance Coin's price remains in a technical bear market after falling nearly 40% from its year-to-date high.Binance Coin's price remains in a technical bear market after falling nearly 40% from its year-to-date high.

Binance Coin price nears death cross as BSC transactions plunge

2025/11/25 01:32
2 min read

Binance Coin’s price remains in a technical bear market after falling nearly 40% from its year-to-date high.

Summary
  • Binance Coin price has plunged by 40% from the year-to-date high.
  • The coin is about to form a death cross pattern on the daily chart.
  • Nansen data shows that the number of transactions has plunged.

Binance Coin (BNB) traded at $847 on Monday, a few points above its lowest level this month. This crash has brought its market cap from nearly $190 billion to $116 billion today. 

The BNB price has plunged amid the ongoing crypto market crash that has affected Bitcoin (BTC) and most altcoins. It also happened amid deteriorating fundamentals in its network. 

Data compiled by Nansen shows that the number of transactions on the BSC Chain has plunged by 63% in the last 30 days to 486 million. This is its worst 30-day drop in months. 

The number of active addresses in the BSC Chain has dropped by 2.9% in the last 30 days to 36.5 million. Most importantly, the network’s fee collection dropped by 72% to $19.2 million. 

BSC’s activity is a sharp contrast to that of other chains in the crypto industry. Base’s transactions jumped by 108% in the last 30 days to 397 million, while Polygon and Avalanche soared by 80% and 54% to 135 million and 62 million, respectively. 

More data shows that, while the amount of stablecoins in the BSC Chain rose to $14.2 billion, the adjusted transaction volume dropped by 34% in the last 30 days to $204.2 billion. 

Binance Coin price technical analysis

binance coin

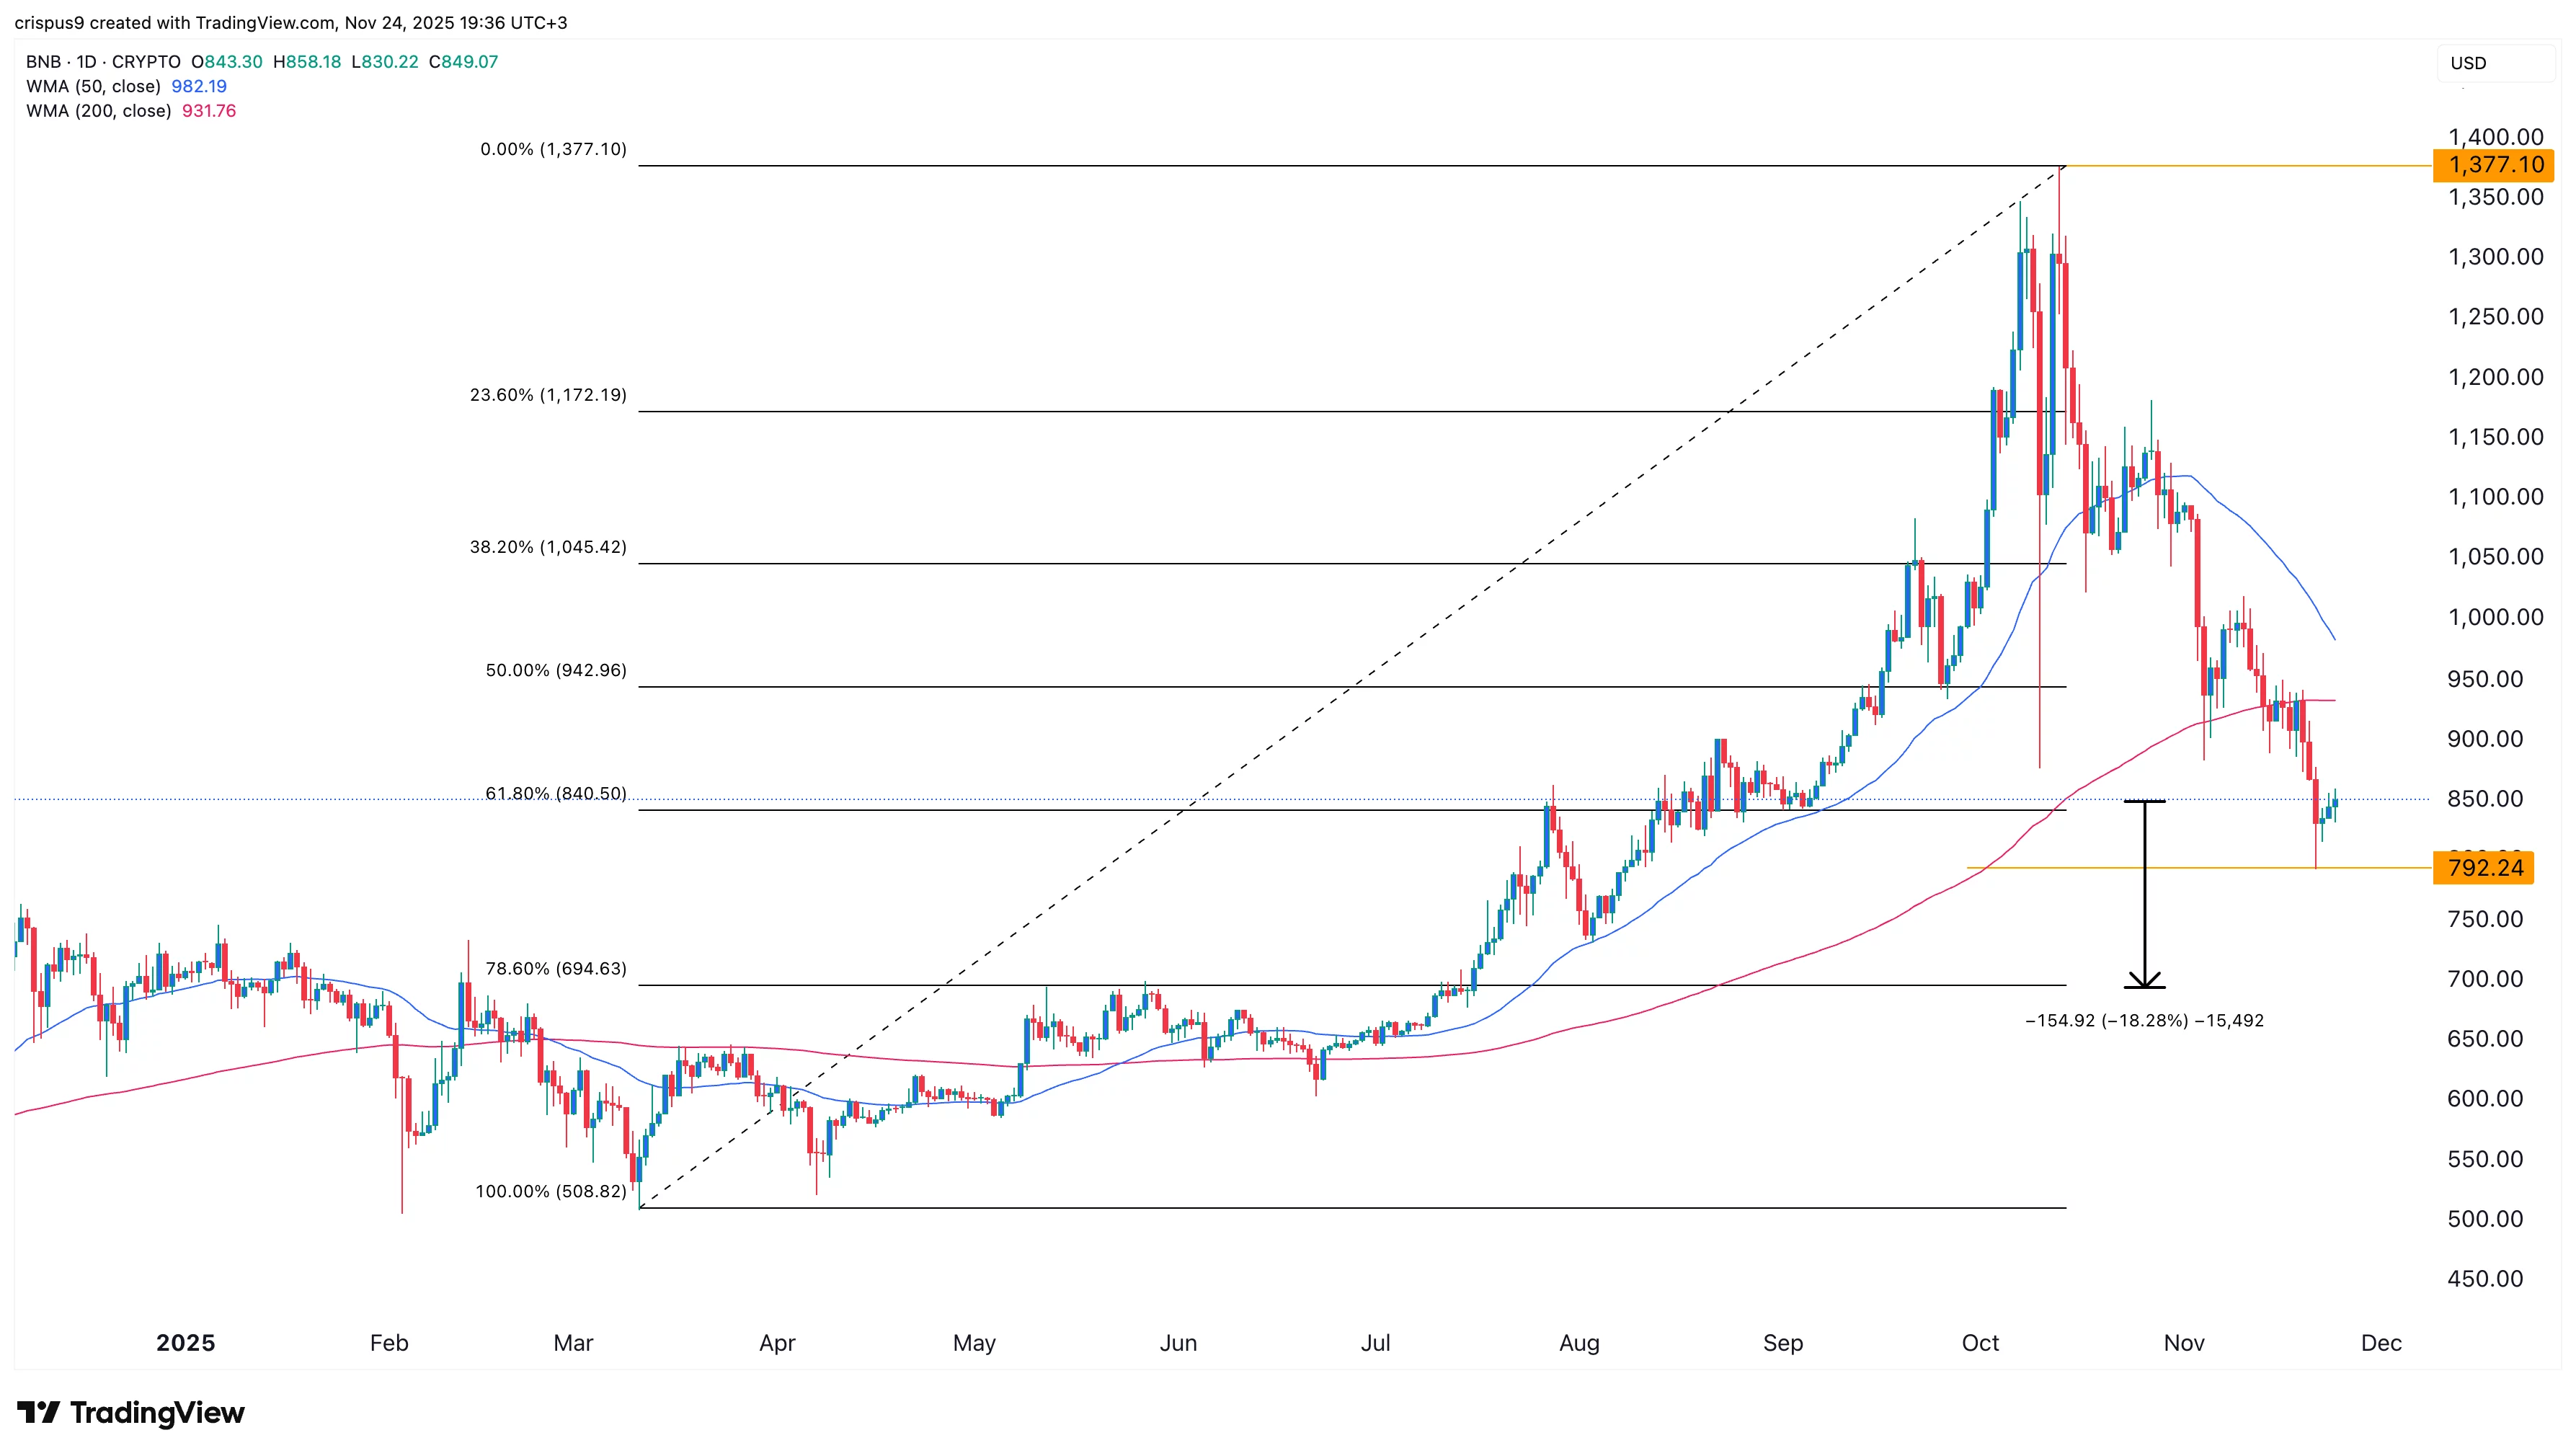
The daily chart shows that the BNB price has remained under pressure in the past few months. It has plunged from the all-time high of $1,377 to the current $850. 

The coin is hovering at the 61.8% Fibonacci Retracement level. Worse, it is about to form the risky death cross pattern, which happens when the 50-day and 200-day Weighted Moving Averages cross each other.

In this case, the 50-day WMA is at $982, while the 200-day WMA is at $930. Also, the coin has dropped below the Supertrend and the Ichimoku cloud indicators. 

Therefore, the most likely BNB price forecast is bearish, with the next key target being at $695, the 78.6% retracement level. This target is about 18.2% below the current level. 

Market Opportunity
CROSS Logo
CROSS Price(CROSS)
$0.10328
$0.10328$0.10328
+0.81%
USD
CROSS (CROSS) Live Price Chart
Disclaimer: The articles reposted on this site are sourced from public platforms and are provided for informational purposes only. They do not necessarily reflect the views of MEXC. All rights remain with the original authors. If you believe any content infringes on third-party rights, please contact service@support.mexc.com for removal. MEXC makes no guarantees regarding the accuracy, completeness, or timeliness of the content and is not responsible for any actions taken based on the information provided. The content does not constitute financial, legal, or other professional advice, nor should it be considered a recommendation or endorsement by MEXC.

You May Also Like

Microsoft Corp. $MSFT blue box area offers a buying opportunity

Microsoft Corp. $MSFT blue box area offers a buying opportunity

The post Microsoft Corp. $MSFT blue box area offers a buying opportunity appeared on BitcoinEthereumNews.com. In today’s article, we’ll examine the recent performance of Microsoft Corp. ($MSFT) through the lens of Elliott Wave Theory. We’ll review how the rally from the April 07, 2025 low unfolded as a 5-wave impulse followed by a 3-swing correction (ABC) and discuss our forecast for the next move. Let’s dive into the structure and expectations for this stock. Five wave impulse structure + ABC + WXY correction $MSFT 8H Elliott Wave chart 9.04.2025 In the 8-hour Elliott Wave count from Sep 04, 2025, we saw that $MSFT completed a 5-wave impulsive cycle at red III. As expected, this initial wave prompted a pullback. We anticipated this pullback to unfold in 3 swings and find buyers in the equal legs area between $497.02 and $471.06 This setup aligns with a typical Elliott Wave correction pattern (ABC), in which the market pauses briefly before resuming its primary trend. $MSFT 8H Elliott Wave chart 7.14.2025 The update, 10 days later, shows the stock finding support from the equal legs area as predicted allowing traders to get risk free. The stock is expected to bounce towards 525 – 532 before deciding if the bounce is a connector or the next leg higher. A break into new ATHs will confirm the latter and can see it trade higher towards 570 – 593 area. Until then, traders should get risk free and protect their capital in case of a WXY double correction. Conclusion In conclusion, our Elliott Wave analysis of Microsoft Corp. ($MSFT) suggested that it remains supported against April 07, 2025 lows and bounce from the blue box area. In the meantime, keep an eye out for any corrective pullbacks that may offer entry opportunities. By applying Elliott Wave Theory, traders can better anticipate the structure of upcoming moves and enhance risk management in volatile markets. Source: https://www.fxstreet.com/news/microsoft-corp-msft-blue-box-area-offers-a-buying-opportunity-202509171323
Share
BitcoinEthereumNews2025/09/18 03:50
Travelzoo Q4 2025 Earnings Conference Call on February 19 at 11:00 AM ET

Travelzoo Q4 2025 Earnings Conference Call on February 19 at 11:00 AM ET

NEW YORK, Feb. 9, 2026 /PRNewswire/ — Travelzoo® (NASDAQ: TZOO): WHAT: Travelzoo, the club for travel enthusiasts, will host a conference call to discuss the Company
Share
AI Journal2026/02/10 01:46
TradFi vs. Crypto: Bybit Launches 300,000 USDT Trading Challenge as Copy Trading Gains Momentum in Volatility

TradFi vs. Crypto: Bybit Launches 300,000 USDT Trading Challenge as Copy Trading Gains Momentum in Volatility

DUBAI, UAE, Feb. 9, 2026 /PRNewswire/ — Bybit, the world’s second-largest cryptocurrency exchange by trading volume, is calling traders across the TradFi and crypto
Share
AI Journal2026/02/10 01:45