Crypto Fear & Greed Index Reveals Shocking Shift to ‘Fear’ Territory – What Investors Must Know
BitcoinWorld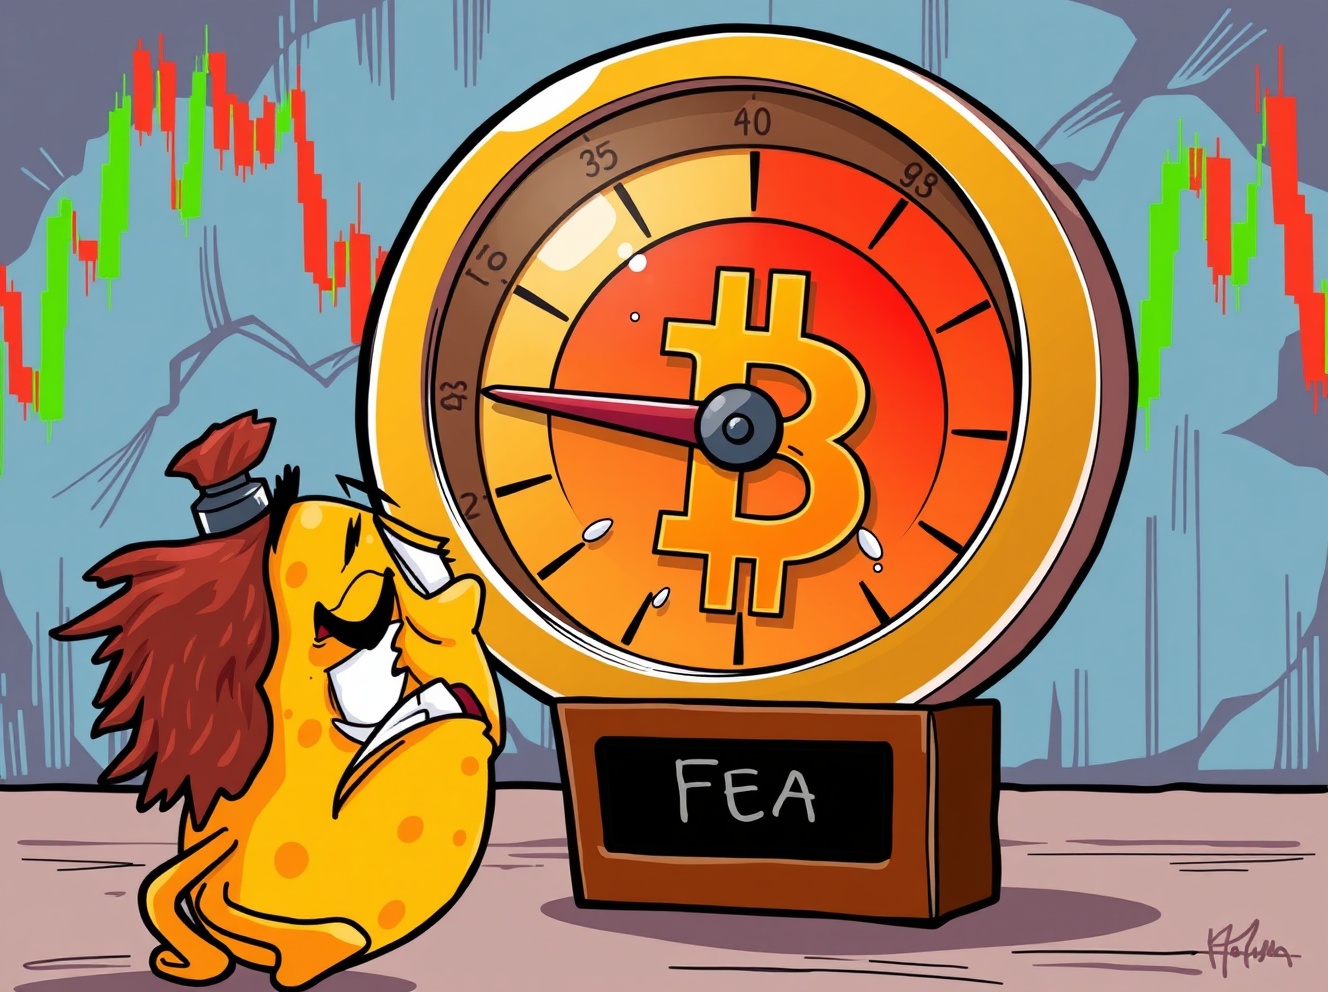
Crypto Fear & Greed Index Reveals Shocking Shift to ‘Fear’ Territory – What Investors Must Know
Market sentiment takes a dramatic turn as the Crypto Fear & Greed Index shifts into ‘Fear’ territory for the first time since November 11. This crucial indicator provides valuable insights into investor psychology and market direction. Understanding the Crypto Fear & Greed Index helps traders navigate volatile conditions and make informed decisions.
What Does the Crypto Fear & Greed Index Shift Mean for Investors?
The Crypto Fear & Greed Index has moved from ‘Extreme Fear’ to ‘Fear’ category, climbing three points to reach 28. This measurement scale ranges from 0 (extreme fear) to 100 (extreme greed), offering a snapshot of market emotions. The index’s movement suggests changing investor sentiment that could influence trading patterns and price action across major cryptocurrencies.
According to data provider Alternative.me, this marks the first time the Crypto Fear & Greed Index has entered the Fear zone since mid-November. This transition indicates that while market anxiety persists, extreme panic has subsided. Investors should monitor these sentiment shifts closely as they often precede significant price movements.
How Is the Crypto Fear & Greed Index Calculated?
The Crypto Fear & Greed Index uses multiple data sources to create a comprehensive market sentiment picture. The calculation methodology includes:
- Volatility (25%) – Measures price fluctuations and market stability
- Market Volume (25%) – Tracks trading activity and investor participation
- Social Media (15%) – Analyzes cryptocurrency discussions and sentiment online
- Surveys (15%) – Gathers direct investor opinions and expectations
- Bitcoin Dominance (10%) – Monitors Bitcoin’s market share relative to altcoins
- Search Trends (10%) – Measures public interest through Google search volume
This multi-factor approach ensures the Crypto Fear & Greed Index reflects genuine market conditions rather than temporary fluctuations. Each component contributes to a balanced assessment of investor psychology.
Why Should You Care About Market Sentiment Indicators?
The Crypto Fear & Greed Index serves as a valuable contrarian indicator for savvy investors. Historically, extreme fear levels often present buying opportunities, while extreme greed may signal potential market tops. The current reading of 28 suggests cautious optimism might be warranted, though careful risk management remains essential.
Many successful traders use the Crypto Fear & Greed Index to time their entry and exit points. When fear dominates the market, prices often drop below fundamental values. Conversely, excessive greed can lead to overvaluation and subsequent corrections. Understanding these patterns helps investors avoid emotional decision-making.
What Actionable Insights Can You Derive From This Shift?
The movement in the Crypto Fear & Greed Index from Extreme Fear to Fear suggests several potential strategies:
- Dollar-cost averaging – Consider gradual position building during fear periods
- Portfolio rebalancing – Adjust allocations based on changing risk appetite
- Risk assessment – Evaluate your tolerance for potential volatility
- Market research – Use sentiment data to complement technical and fundamental analysis
Remember that the Crypto Fear & Greed Index represents one tool among many. Combine it with other analysis methods for comprehensive market understanding. The index’s current reading indicates markets are transitioning from panic to cautious assessment.
Final Thoughts: Navigating Market Sentiment Shifts
The Crypto Fear & Greed Index provides crucial insights into market psychology that technical analysis alone cannot capture. The shift to Fear territory marks an important transition that investors should monitor closely. While sentiment indicators don’t guarantee future performance, they offer valuable context for decision-making.
Successful cryptocurrency investing requires balancing multiple data sources. The Crypto Fear & Greed Index serves as your emotional compass in turbulent markets. Use it to maintain perspective when others succumb to fear or greed extremes.
Frequently Asked Questions
What is the Crypto Fear & Greed Index?
The Crypto Fear & Greed Index measures market sentiment on a scale from 0 (extreme fear) to 100 (extreme greed) using multiple data sources including volatility, volume, and social media sentiment.
How often is the Crypto Fear & Greed Index updated?
The index updates daily, providing current market sentiment readings that help investors gauge prevailing market psychology.
What does a Fear reading indicate?
A Fear reading suggests investors are cautious and potentially pessimistic about short-term price movements, which sometimes presents buying opportunities for long-term investors.
Can the Crypto Fear & Greed Index predict price movements?
While not a perfect predictor, extreme readings often coincide with market reversals, making it a valuable contrarian indicator when used with other analysis tools.
How reliable is the Crypto Fear & Greed Index?
The index provides reliable sentiment data when understood as one component of comprehensive market analysis rather than a standalone trading signal.
Where can I check the current Crypto Fear & Greed Index?
You can monitor the index directly on Alternative.me or through various cryptocurrency news platforms and market analysis tools.
Found this analysis helpful? Share this article with fellow investors who could benefit from understanding market sentiment indicators. Help your network make informed decisions by spreading valuable insights about the Crypto Fear & Greed Index.
To learn more about the latest crypto market trends, explore our article on key developments shaping Bitcoin price action and institutional adoption.
This post Crypto Fear & Greed Index Reveals Shocking Shift to ‘Fear’ Territory – What Investors Must Know first appeared on BitcoinWorld.
You May Also Like

PBOC sets USD/CNY reference rate at 6.8943 vs. 6.9041 previous
WTI Crude Oil Soars: Middle East Tensions Spark Critical Supply Fears and Market Volatility