

DOT Polkadot crypto outlook: can bears keep control?
 DOT Polkadot crypto is trading in a decisively defensive posture, with price action pressed against the lower edge of its recent range and sentiment across the market turning risk-off. However, even in this heavy environment, the technical picture offers clues about whether this downtrend is close to exhaustion or still has room to run.
 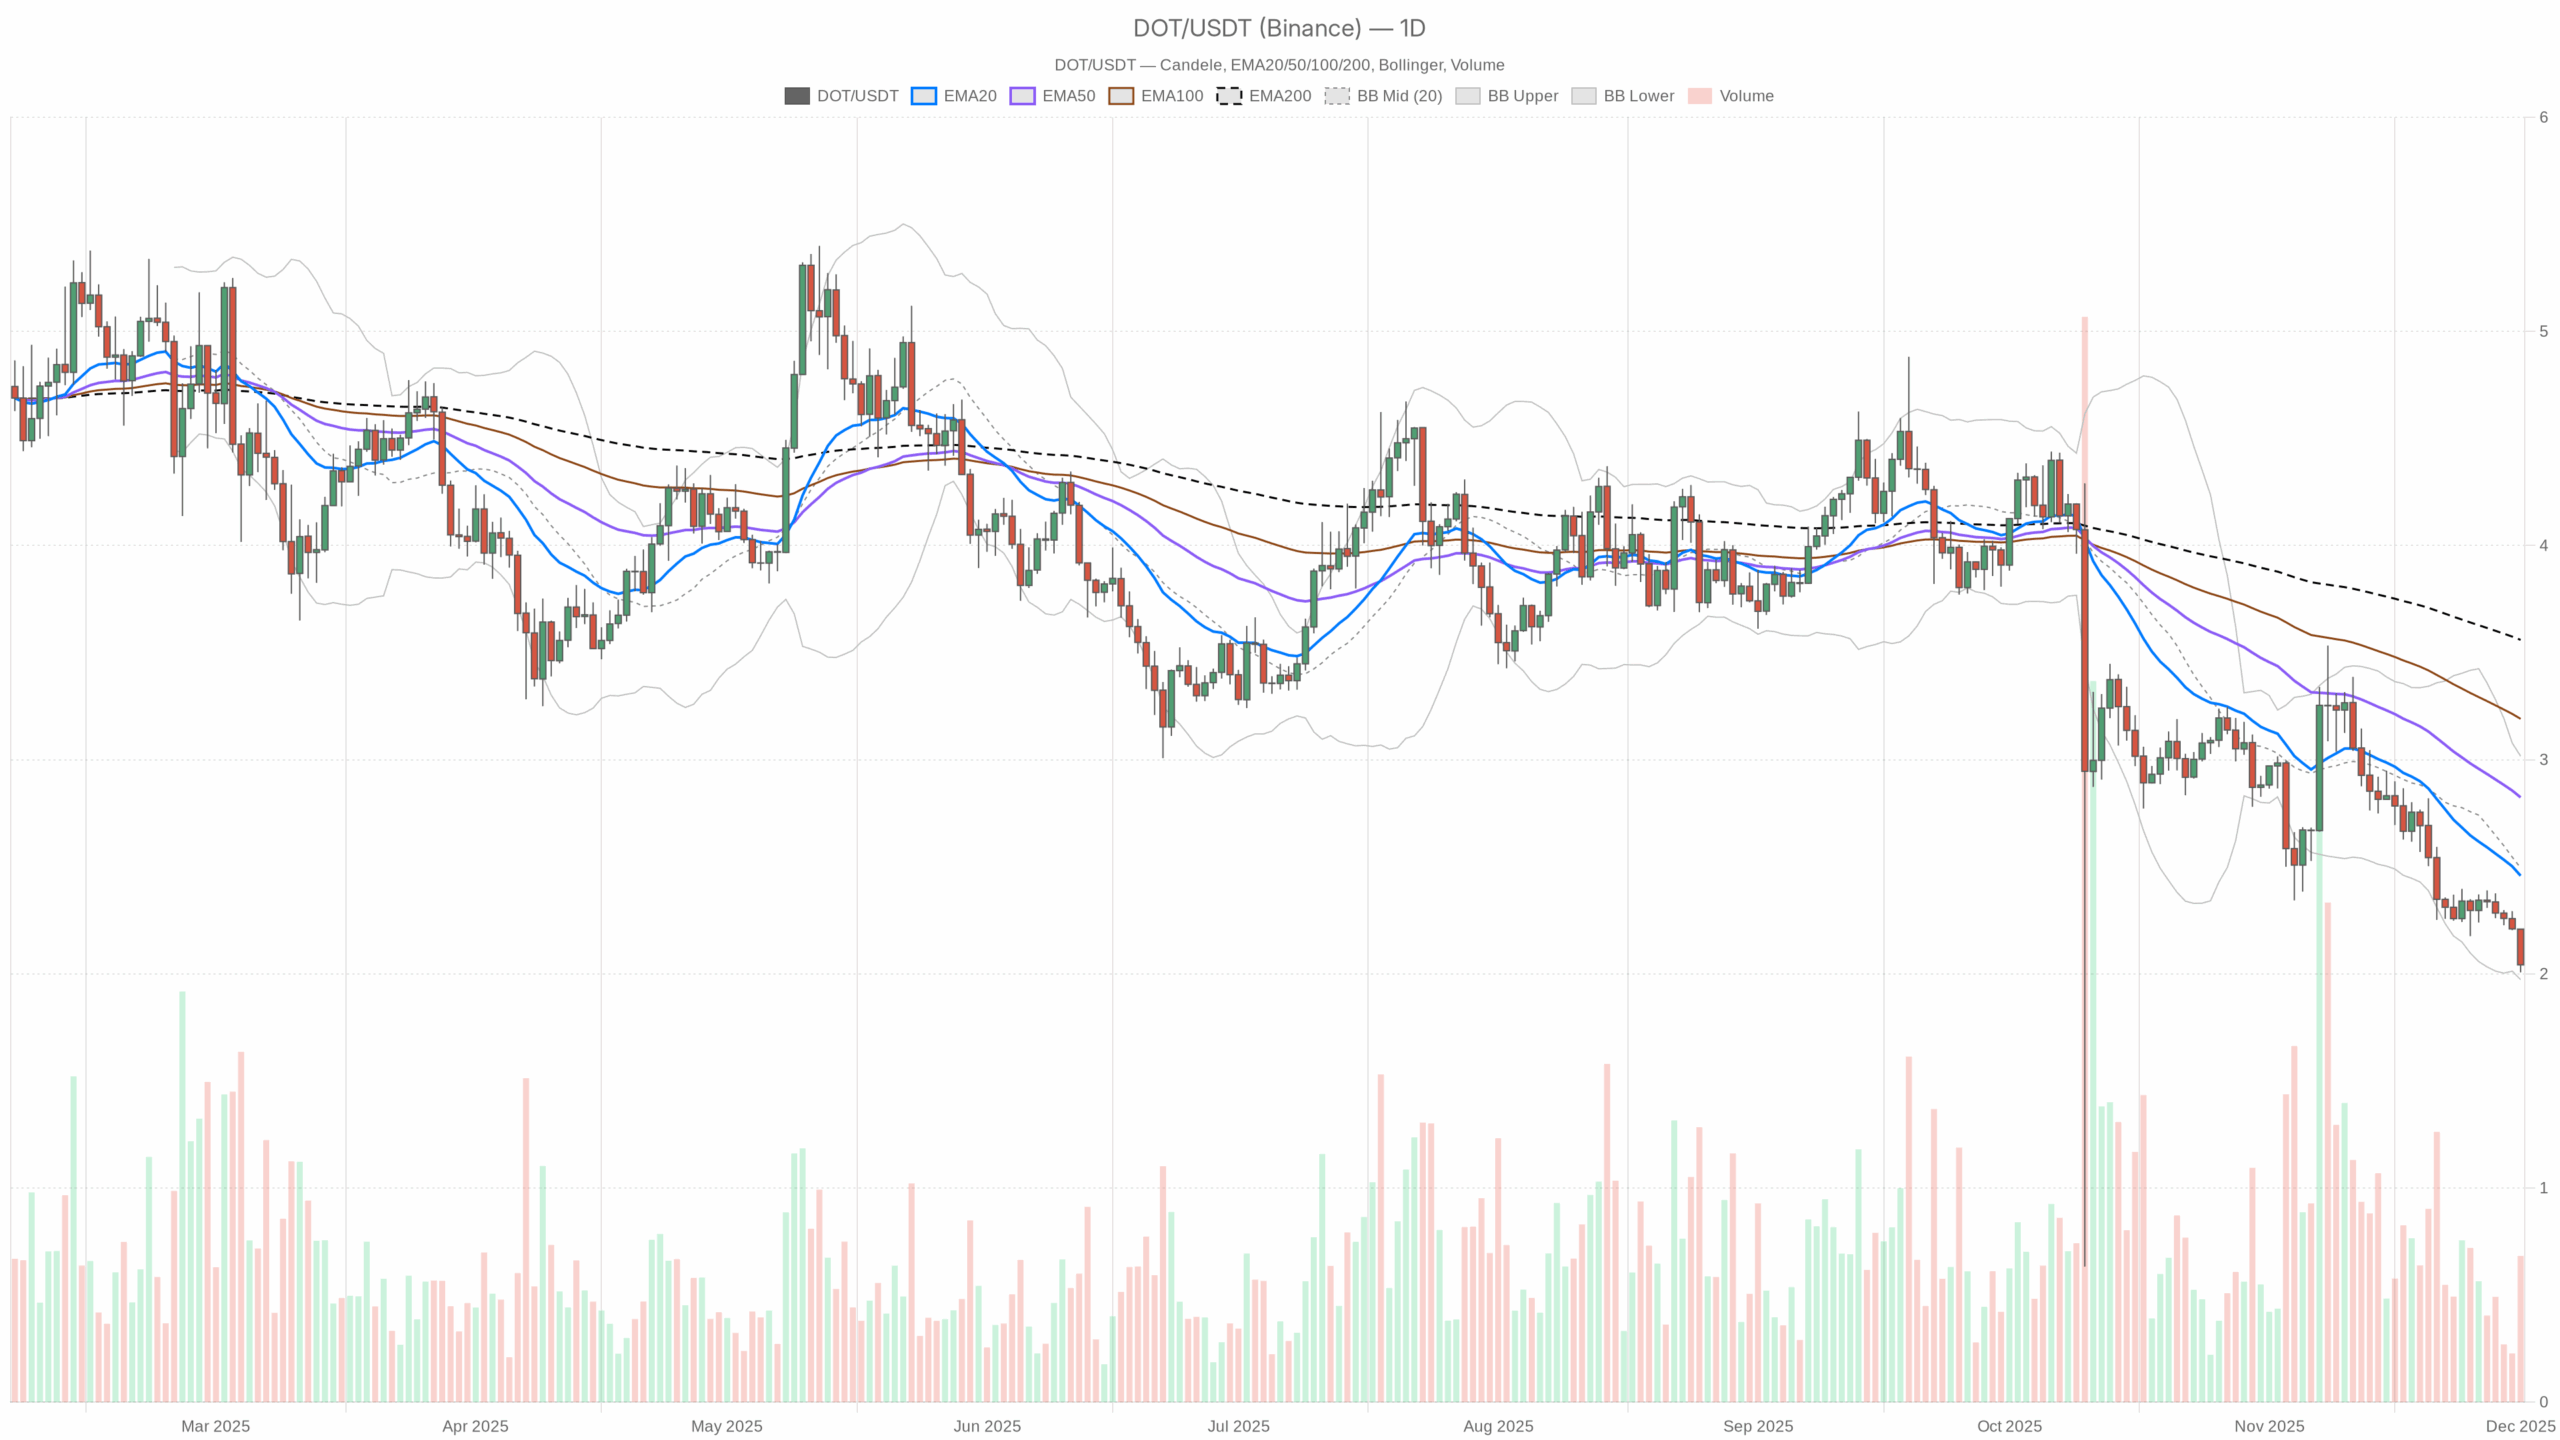 DOT/USDT — daily chart with candlesticks, EMA20/EMA50 and volume.
Summary
On the daily chart, DOTUSDT sits around 2.04 dollars, firmly below its short-, medium-, and long-term moving averages, underlining a dominant bearish trend. Momentum indicators lean toward oversold, hinting at selling fatigue but not yet signaling a confirmed rebound. Moreover, volatility is modest, with the daily Average True Range near 0.16 dollars, suggesting controlled but persistent pressure rather than panic. The broader crypto market has shed about 4.9% of total capitalization in 24 hours, amplifying caution among traders. Bitcoin dominance near 57% points to capital rotating into the relative safety of the benchmark rather than altcoins. Overall, investors appear defensive, waiting for clearer signs that the current downtrend has either stabilized or broken decisively lower.
DOT Polkadot crypto: Market Context and Direction
The broader backdrop is hardly benign for altcoins. The global crypto market cap stands around 3.03 trillion dollars, but has fallen almost 5% over the last day, underscoring a synchronized risk-off move. Moreover, Bitcoin’s market share at roughly 57% shows a clear flight-to-quality regime in which capital concentrates in the largest, most liquid asset while peripheral tokens lag.
The Fear & Greed Index sits at 24, classified as Extreme Fear. That said, such readings often appear late in a down cycle, when many weak hands have already capitulated. This does not guarantee an immediate bounce, yet it does imply that downside momentum may be closer to exhaustion than to its early stages. For this asset, that means the primary scenario is still bearish, but the risk-reward profile for fresh shorts is becoming less attractive compared with earlier in the decline.
Technical Outlook: reading the overall setup
On the daily timeframe, price at 2.04 dollars trades well below the 20-day exponential moving average at 2.46, the 50-day at 2.82, and the 200-day at 3.56. This wide separation of EMAs signals a mature downtrend with entrenched selling pressure. As long as the token remains beneath the 20-day average, any bounce should be treated as a rally within a broader bearish structure, not a confirmed reversal.
The 14-day RSI stands near 26.7, in oversold territory. However, oversold does not always mean a bottom; rather, it confirms heavy downside momentum and suggests that while further losses are possible, the probability of sharp countertrend rallies increases. Traders should therefore be prepared for volatility spikes if short covering accelerates.
MACD on the daily chart shows the line at -0.21, just under the signal at -0.20, with a slightly negative histogram. This reflects a waning bearish impulse: sellers still dominate, but the pace of decline is slowing. A flattening or crossing of the MACD line above the signal in coming sessions would be an early sign that downside energy is fading.
Bollinger Bands center around 2.49 dollars, with the upper band near 3.02 and the lower at 1.97. Price is hugging the lower band, a classic sign of trend persistence rather than immediate reversal. However, when combined with oversold RSI, this posture also warns that any positive catalyst could trigger a snap-back toward the middle band, even if the larger bearish regime remains intact.
The daily ATR of about 0.16 dollars indicates moderate daily swings. As a result, the market is experiencing orderly, controlled volatility rather than the chaotic spikes that often accompany capitulation lows or euphoric tops. This supports the view of a grinding downtrend rather than a crash.
Intraday Perspective and DOTUSDT token Momentum
Looking at the hourly chart, price at 2.04 dollars also trades below the 20-, 50-, and 200-period EMAs (2.12, 2.2, and 2.31 respectively). Meanwhile, the hourly regime remains bearish, meaning short-term flows are aligned with the daily downtrend. This alignment typically favors continuation trades rather than aggressive countertrend bets.
The hourly RSI around 28.8 is similarly oversold, reinforcing the idea that intraday selling has been intense. MACD on this timeframe stays slightly negative, showing no clear sign of a bullish turn yet. However, the 15-minute chart tells a more nuanced story: here, price sits roughly on the 20-period EMA at 2.04, with RSI near 44 and a marginally positive MACD histogram. This subtle intraday stabilization hints that short-term momentum may be attempting to base, even as higher timeframes remain under pressure.
Key Levels and Market Reactions
On the daily pivot framework, the central pivot sits at 2.09 dollars. Trading below this mark keeps the immediate bias negative. The first nearby support area emerges around 1.97–2.00 dollars, close to the lower Bollinger Band and slightly below the S1 region. A decisive break under this zone could open the door to a fresh leg down, confirming trend continuation and likely inviting momentum sellers back into the market.
On the upside, the first resistance zone is clustered near 2.15–2.20 dollars, where the daily pivot’s upper band overlaps with the hourly moving averages. If price can reclaim and hold above this band, it would signal that buyers are finally pushing back, potentially targeting the 20-day EMA near 2.46 as a medium-term magnet. Such a move would not overturn the broader bearish regime on its own, but it would mark a meaningful test of whether the market is ready for a deeper recovery.
Future Scenarios and Investment Outlook
Overall, the charts describe a market still locked in a bearish pattern, yet with growing evidence of fatigue among sellers. As long as the token trades beneath the 20-day EMA and below the 2.09 pivot, the base case remains for sideways-to-lower action, punctuated by occasional sharp rallies as short positions are unwound. More aggressive traders might look to fade strength near resistance, while conservative participants may prefer to wait for clear trend confirmation in the form of higher lows and sustained closes back above key moving averages.
Conversely, if support near the lower band breaks decisively, the path of least resistance remains down, and risk management becomes paramount. In all cases, position sizing and disciplined stop-loss placement are essential, given the combination of oversold momentum and a still-bearish backdrop that can produce both sudden squeezes and renewed breakdowns.
This analysis is for informational purposes only and does not constitute financial advice.
Readers should conduct their own research before making investment decisions.


You May Also Like

Trump claims Iran agreement framework complete amid market skepticism

The List of the Top 15 Most Searched Altcoins in Recent Hours Has Been Revealed!


