Lunc crypto: can bullish intraday momentum survive a fearful market?
 Lunc crypto traders are facing a peculiar setup: strong intraday enthusiasm colliding with a cautious higher timeframe backdrop and a broadly weak crypto environment.
In this piece we will unpack how daily and intraday indicators line up, what that says about current momentum, and which price zones could shape the next significant move.
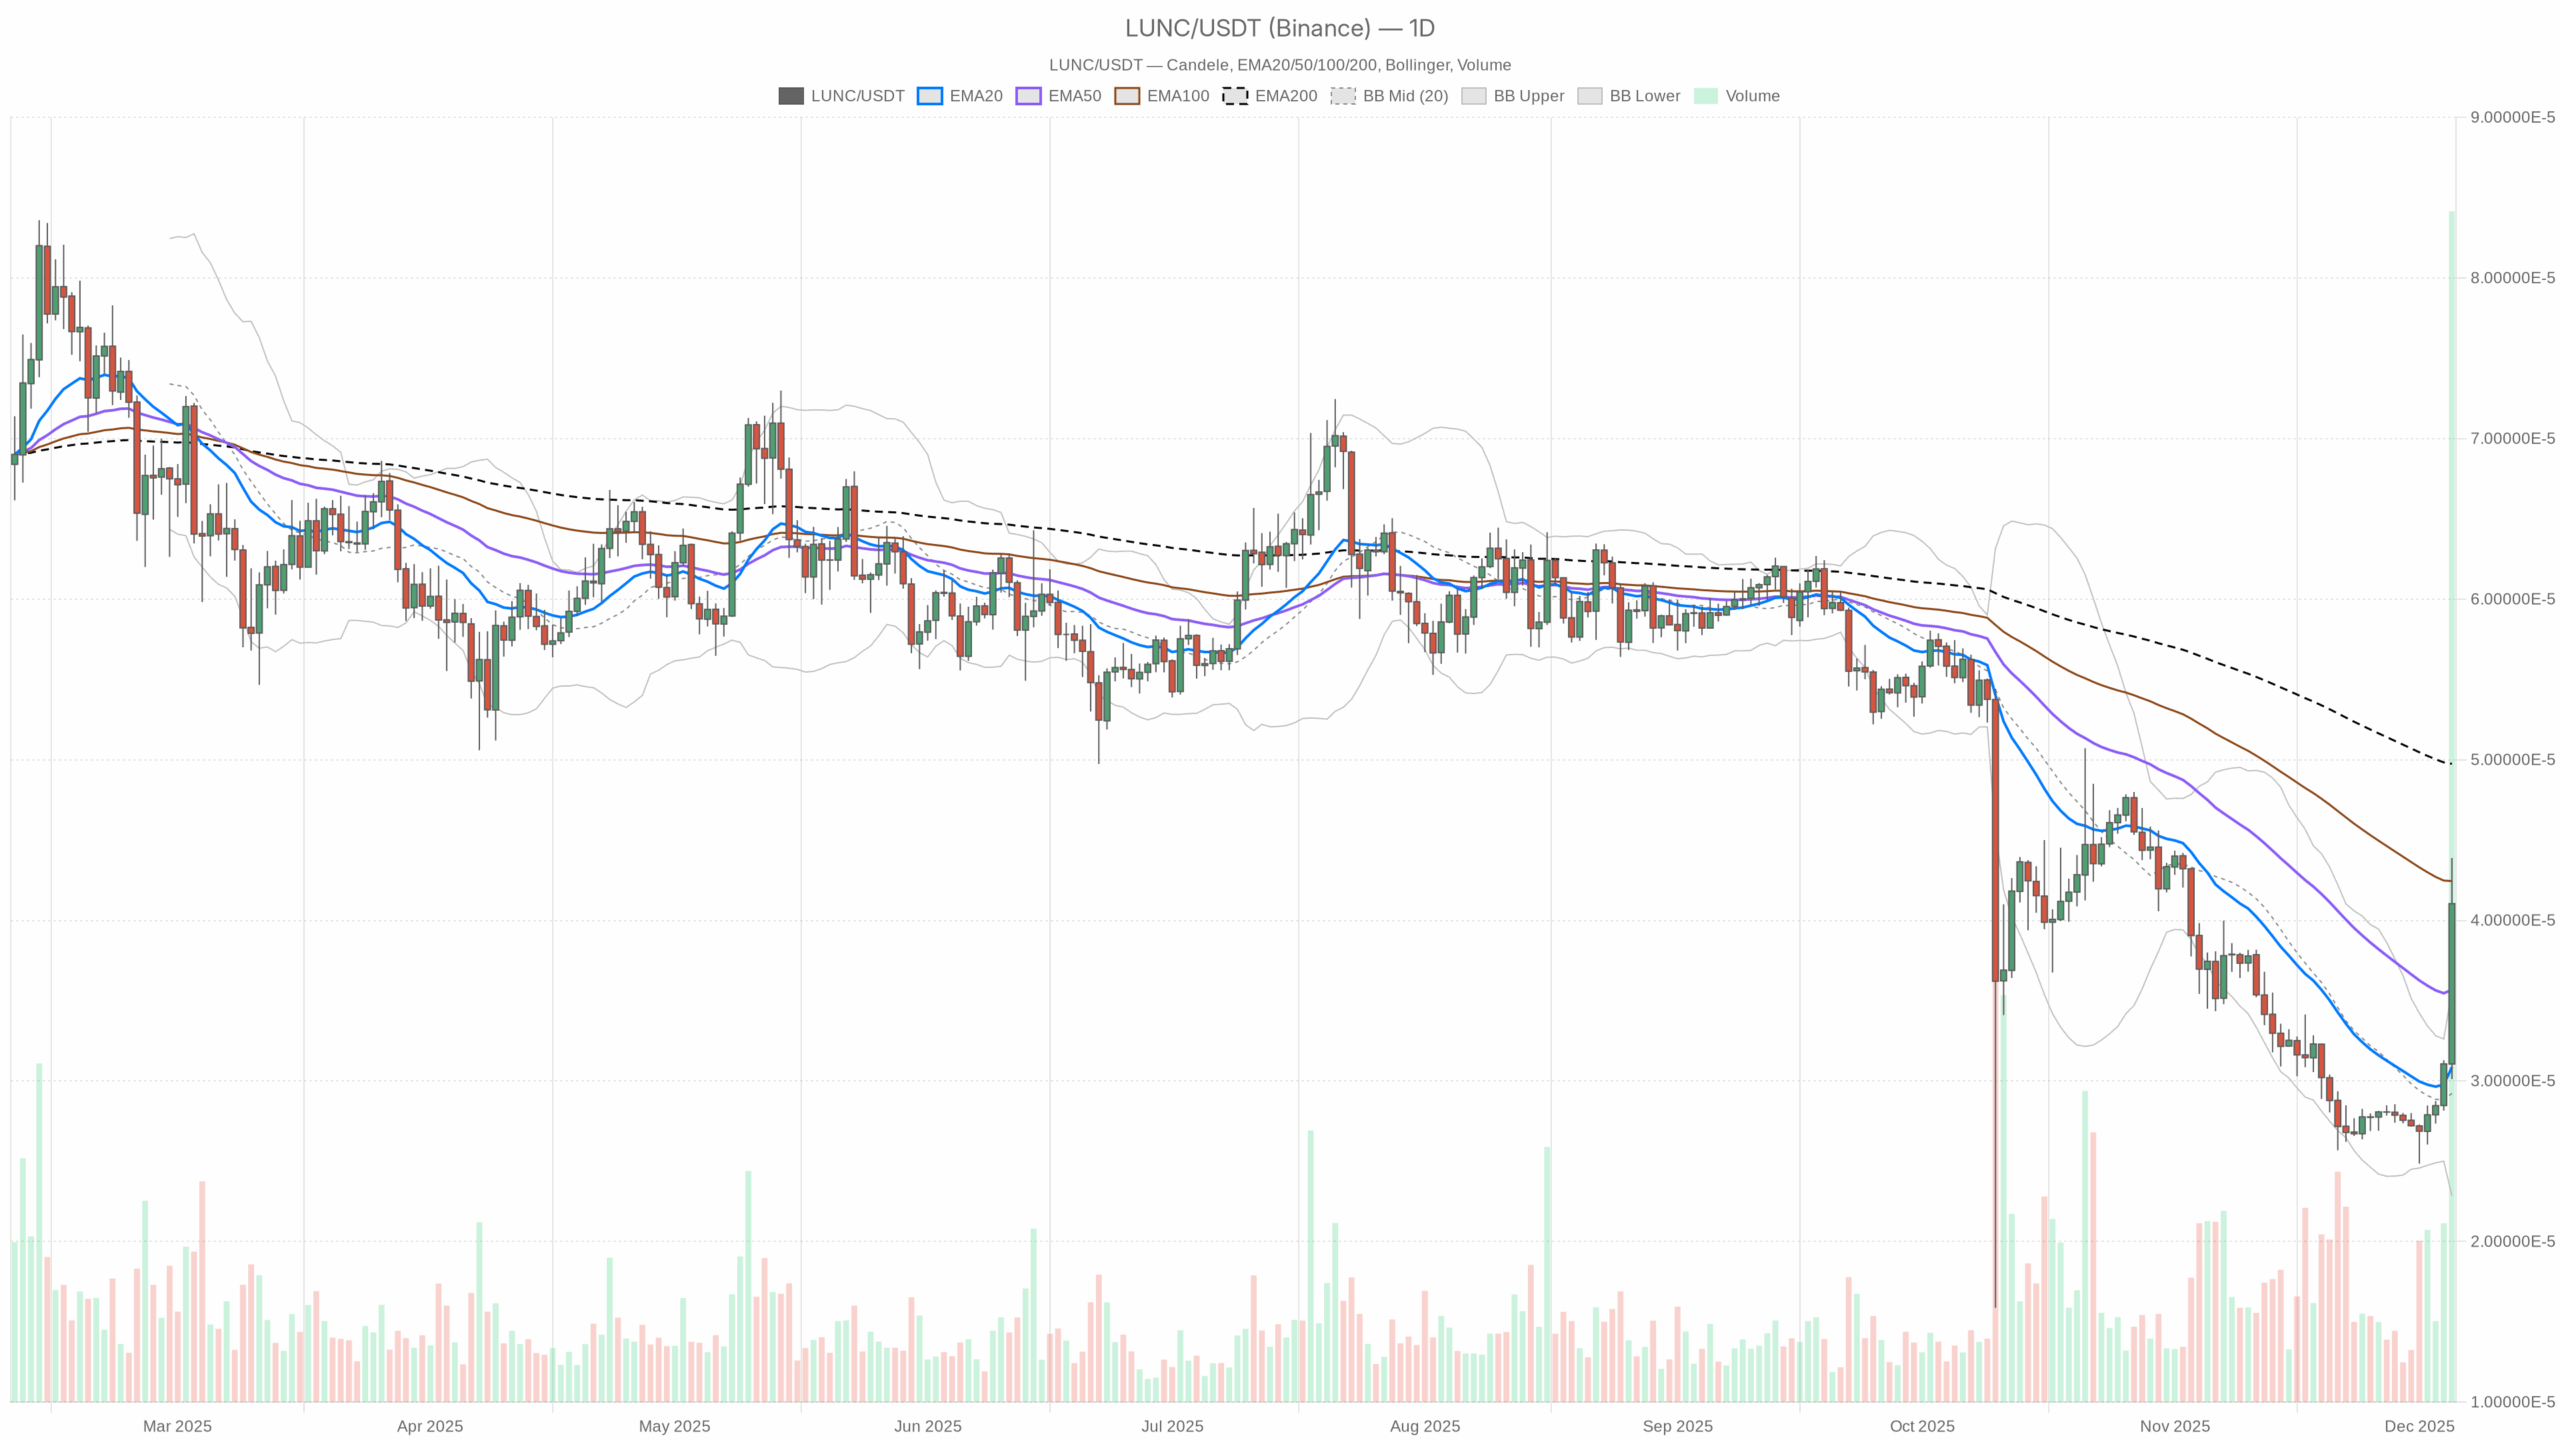 LUNC/USDT — daily chart with candlesticks, EMA20/EMA50 and volume.
Summary
The broader market is under pressure, with global capitalization near $3.17 trillion and falling about 2% over the last 24 hours. Bitcoin dominance hovers around 57%, showing that capital still prefers the largest asset while altcoins struggle to attract fresh flows. Sentiment is fragile: the Fear & Greed Index sits at 28, in clear fear territory, limiting risk appetite for speculative tokens.
Against this background, the daily regime for the asset remains officially neutral, pointing to an absence of a clear, established trend. However, intraday timeframes lean bullish, with elevated RSI levels hinting at aggressive short-term buying. Overall, the market is caught between short-term momentum and a hesitant macro backdrop, increasing the risk of sharp swings in either direction.
Lunc crypto: Market Context and Direction
The current environment for this token cannot be separated from the broader crypto picture. Total market capitalization around $3.17 trillion, combined with a negative 24-hour change of roughly 2%, suggests a corrective or cooling phase after prior strength. Moreover, with Bitcoin capturing about 57% of total value, liquidity is clustering in the benchmark asset rather than flowing freely into smaller caps.
This backdrop matters because it often dampens the sustainability of aggressive altcoin rallies. The Fear & Greed Index at 28 underscores this: investors are still in a risk-off psychological regime, quicker to take profits and slower to chase breakouts. That said, the token’s intraday indicators show buyers trying to push higher despite caution elsewhere. The tension between a fearful macro context and localized bullish attempts is the defining feature of the current setup.
Technical Outlook: reading the overall setup
On the daily timeframe, the system classifies the regime as neutral. Without clear separation between price and its long-term moving averages, the chart likely oscillates in a wide range rather than in a clean uptrend or downtrend. In such conditions, traders often respond more to short bursts of news or flows than to a sustained narrative, reinforcing the importance of intraday signals.
The daily RSI at about 73 is the most meaningful clue here. This reading comfortably sits in overbought territory, indicating that recent sessions have been dominated by buyers. However, in a neutral regime, an overbought RSI often signals momentum exhaustion risk rather than the start of a durable bull leg. It suggests that while the path of least resistance has recently been up, the probability of consolidation or a corrective pause is rising.
The MACD values on the daily chart show no meaningful separation between the line and signal, reinforcing the narrative of a non-committal trend structure. When MACD fails to show a decisive positive or negative spread, rallies often lack strong confirmation from underlying momentum. Bollinger Bands data are not offering a clear signal either, which fits a context where price is not executing a textbook volatility breakout but rather grinding inside a broader range.
ATR on the daily side is subdued, pointing to contained realized volatility. This is consistent with a neutral regime where directional conviction is limited and large trending candles are less frequent. Pivot levels, although numerically flat in the dataset, function conceptually as reference points where traders watch for reactions; in a neutral market, interactions with these zones often produce choppy reversals instead of clean follow-through.
Intraday Perspective and LUNC crypto price Momentum
Meanwhile, the intraday landscape looks more energetic. On the 1-hour timeframe, the regime turns bullish, and the RSI climbs to around 78. Such a strong reading indicates that short-term traders have been aggressively bidding the token, pushing it into overbought territory. As a result, a short-term upside extension cannot be ruled out, but so cannot a fast shakeout if late buyers become trapped.
The 15-minute chart also shows a bullish regime, with RSI near 61. This supports the idea of multi-timeframe alignment in favor of buyers at the intraday level: both scalpers and hourly traders are leaning in the same direction. However, because the broader daily regime stays neutral, this alignment looks more like a fast swing or local pump than the start of a stable macro uptrend.
MACD on shorter timeframes does not show a pronounced edge, implying that the micro-trend is driven more by flows and sentiment than by a mature, well-anchored trend. Still, when both the 1-hour and 15-minute regimes read bullish, price often respects higher intraday supports, rewarding dip-buying strategies until a clear reversal signal emerges.
Key Levels and Market Reactions
Even without explicit price references from the dataset, we can still describe how the key zones likely behave. With intraday RSI stretched above 70 on the hourly chart, the nearest resistance area is likely just above recent highs, where profit-taking tends to appear. If price stalls there with fading momentum, it would echo the daily overbought signal and increase the odds of a pullback.
On the downside, supports are usually found around prior consolidation areas and near dynamic levels such as short-term moving averages. In a neutral macro regime, reactions at these supports become crucial: firm bounces would confirm ongoing dip-buying appetite, while sharp breaks with volume would reveal that the recent bullish push was temporary. Traders will therefore watch how price behaves around intraday floors to gauge whether the market still believes in the current upswing.
Open your Investing.com account
This section contains a sponsored affiliate link. We may earn a commission at no additional cost to you.
Future Scenarios and Investment Outlook about LUNC price
Overall, the main scenario emerging from these readings is a short-term bullish bias embedded within a neutral higher timeframe regime. This means the path ahead is likely dominated by swings, where rallies can be sharp but vulnerable to fast reversals once intraday euphoria collides with broader market fear. If Bitcoin dominance remains elevated and the Fear & Greed Index stays in fear, upside on this token could be capped by limited risk appetite.
For active traders, one pragmatic approach is to respect the current intraday strength while closely monitoring overbought signals and reactions near recent highs. Swing participants may prefer to wait for either a clearer breakout on the daily chart, backed by convincing momentum confirmation, or for a corrective dip that normalizes RSI before considering exposure. Until that happens, this asset sits in a delicate balance between local optimism and a cautious macro backdrop.
This analysis is for informational purposes only and does not constitute financial advice.
Readers should conduct their own research before making investment decisions.


You May Also Like

GOP lawmaker hit with death threats from irate conservatives for pushing immigration deal

Silver Price Analysis: Plummets After Critical Trendline Break, Eyes $70 Target