Ethereum Price Prediction: ETH Traders Quietly Lost Millions in ‘Sandwich Attacks’ – New Signal Hints at a Safer, More Bullish ETH
In this attack method, bots frontrun and backrun a trade, forcing the victim into a worse price while the attacker profits from the difference.
According to Cointelegraph Research and EigenPhi, over 95,000 sandwich attacks were recorded between November 2024 and October 2025.
This comes just as new on-chain signals suggest Ethereum may be entering a safer, more bullish phase.
Indeed, one that could reshape the ETH price prediction outlook moving forward.
Millions Lost via Sandwich Attacks
Annual trader losses move near $60 million. Most of this value shifts toward block builders through gas fees. Attackers capture a margin close to 5%. Nearly 40% of these attacks struck low‑volatility pools.
These pools include stablecoins, wrappers and liquid staking tokens of Ether and Bitcoin. Around 12% of all attacks hit stable swaps.
This creates unexpected damage due to the assumption that these pools remain stable under most market conditions.
Monthly extraction moved from nearly $10 million in late 2024 to about $2.5 million by October 2025. Monthly net profits averaged $260K, inflated by one attack in January that alone generated more than $800K.
Despite this decline, the total number of attacks stayed high. The data show 60K-90K attacks each month across the one‑year period. Almost 70% of all attacks can be traced to a single entity known as Jared.
This operator uses a v2 bot that targets as many as four victims at once. It sometimes places a center transaction to force worse swap rates for the next victims. It can also manipulate price through liquidity adjustments.
ETH Price Analysis: Potential Reversal Window Appears
ETH chart shows a structure formed through a set of lower highs and higher lows. A break above the red resistance band near $3,600 could push prices toward $4K and then $5K.
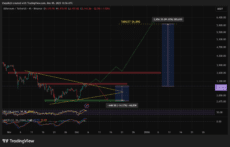
Source: TradingView
The chart shows a projected move toward $6K in the bullish case, a 91% climb from the current level near $3,140.
However, this is only possible following a strong close above the multi‑week supply zone.
A pullback to $2800 is also possible if the $3k price level does not hold. The chart highlights a possible 14% decline toward the green demand zone.
A Safer and More Bullish Ethereum?
The report noted a fall in total extraction, which shows that MEV protection tools have started to limit damage. Yet a full solution requires native support in the protocol.
Combined with technical signs of a possible trend reversal, the broader picture suggests that Ethereum moves toward a phase where traders may suffer fewer silent losses.
ETH Eyes $6K Level as New $SUBBD Presale Prepares to Launch
While ETH eyes the $6K price tag, SUBBD ($SUBBD), a bridge between content creators and their dedicated audiences, has raised a whopping $1.3 million in its ongoing presale.
SUBBD transforms the lucrative subscription-based content market by blending AI with blockchain technology.
The $SUBBD token holders can enjoy discounted subscriptions, staking rewards, and opportunities to sponsor or boost creators they admire.
$SUBBD holders are also eligible for 20% per annum in staking rewards.
To get involved, head over to the SUBBD official website and connect a supported wallet, like Best Wallet.
You can swap existing crypto or use a debit/credit card to complete the transaction in seconds.
nextThe post Ethereum Price Prediction: ETH Traders Quietly Lost Millions in ‘Sandwich Attacks’ – New Signal Hints at a Safer, More Bullish ETH appeared first on Coinspeaker.


You May Also Like

US Blockades Iranian Ports in Strait of Hormuz: Oil Prices Spike Higher – Bitcoin News

Uphold’s Massive 1.59 Billion XRP Holdings Shocks Community, CEO Reveals The Real Owners