The ongoing Trump Coin price crash mirrors the performance of other Trump-related assets. Trump Media, WLFI... both down for the year.The ongoing Trump Coin price crash mirrors the performance of other Trump-related assets. Trump Media, WLFI... both down for the year.

Trump Coin price slumps as whale selling intensifies

2025/12/06 02:50

The Trump Coin price continued its downtrend, reaching its lowest level since October as whale selling intensified. 

Summary
  • Trump meme coin price has crashed from $50 in January to $5 today.
  • The decline mirrors that of other Trump-related assets.
  • Whales have continued dumping the token this year.

Official Trump (TRUMP) dumped to a low of $5.78, down by over 40% from its highest point in October. It remains much lower than its January high of nearly $50. 

The ongoing Trump Coin price crash has mirrored the performance of other Trump-related assets. Trump Media stock has dropped by over 70% this year, while the World Liberty Financial token is down sharply from its peak. 

American Bitcoin, which is mostly owned by the Trump family, cratered by over 40% this week as the lock-up expiry happened. Similarly, AL5, which owns WLFI tokens has been on a freefall.

The ongoing Trump Coin price crash is likely because of his falling approval rating among Democrats and Republicans. It is also because of the increased selling by investors. 

Data compiled by Nansen shows that whales have been on a selling spree in the past few months. These investors now hold 3.84 million tokens, down sharply from 5.3 million in November. Whale selling often leads to more downward pressure because of their substantial holdings.

Whales have dumped Trump Coin

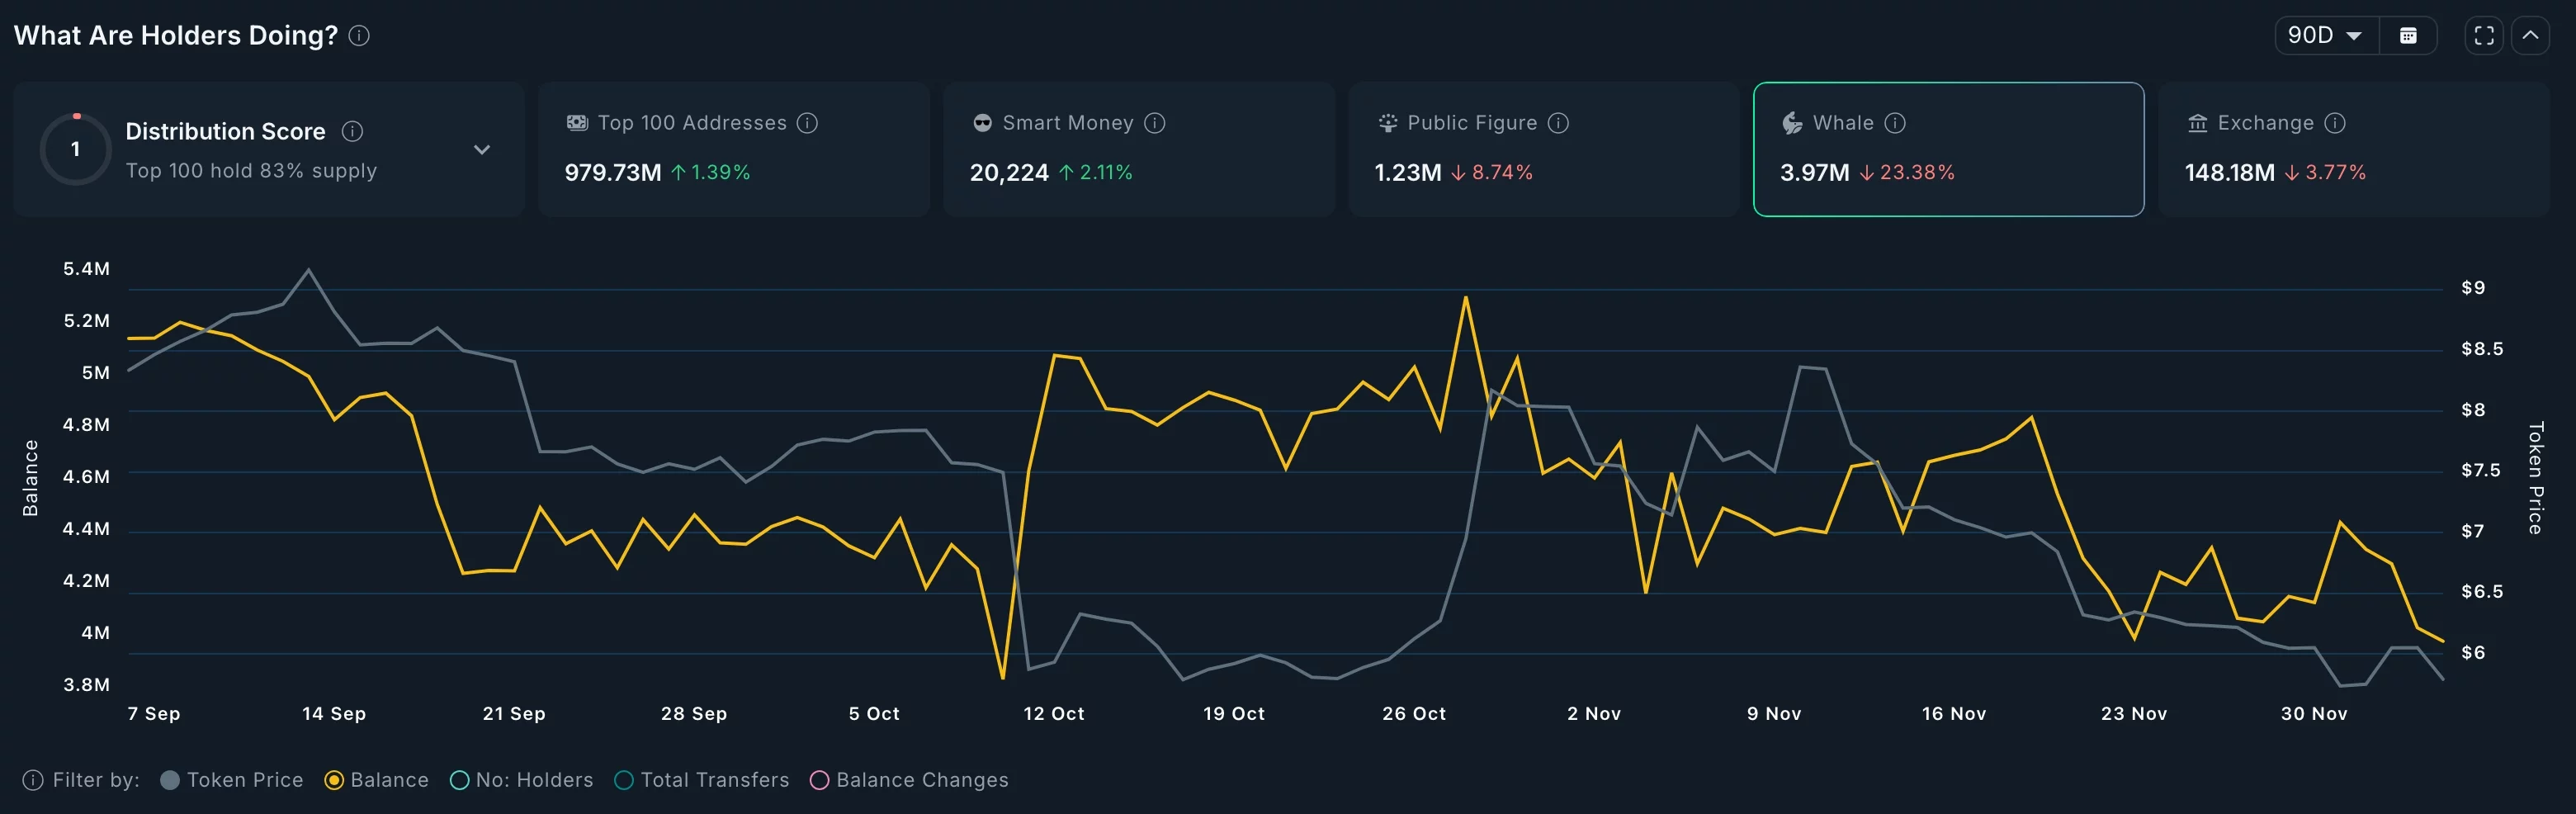
The crash has also coincided with the rising tokens on exchanges. There are now 148 million tokens, up sharply from 147 million in November this year.

Demand for the coin has also slumped in the futures market, where its futures open interest has been in a freefall. 

Trump Coin price technical analysis 

Trump Coin price

The daily timeframe chart shows that the Trump meme coin price has slumped this month. It has fallen from last month’s high of $9.56 to the current $5.80.

The token has remained below all moving averages, while the Percentage Price Oscillator has moved below zero and is pointing downwards.

Therefore, the most likely outlook is where the token continues falling, with the initial target being the all-time low of $4.57. This target price is ~22% below the current level.

A drop below that level will have it move below $4 this month. On the flip side, a move above the resistance at $7 will point to more gains, potentially to the October high of $9.56. 

Disclaimer: The articles reposted on this site are sourced from public platforms and are provided for informational purposes only. They do not necessarily reflect the views of MEXC. All rights remain with the original authors. If you believe any content infringes on third-party rights, please contact service@support.mexc.com for removal. MEXC makes no guarantees regarding the accuracy, completeness, or timeliness of the content and is not responsible for any actions taken based on the information provided. The content does not constitute financial, legal, or other professional advice, nor should it be considered a recommendation or endorsement by MEXC.

You May Also Like

XRP Moves Sideways Above $2.00

XRP Moves Sideways Above $2.00

The post XRP Moves Sideways Above $2.00 appeared on BitcoinEthereumNews.com. // Price Reading time: 2 min Published: Dec 05, 2025 at 21:05 Today, the XRP price has reached a low of $2.00. XRP long-term analysis: bearish Since November 24, the price of XRP has remained below the 21-day moving average. Following the price drop on October 10, as Coinidol.com reported, the price has stabilised above the $1.80 support and below the 21-day SMA barrier. The cryptocurrency has repeatedly broken above the 21-day SMA, but buyers have been unable to sustain bullish momentum above this level. Now, if the current support is breached, bearish momentum is likely to continue towards the low of $1.82. Currently, XRP is around $2.07. XRP price indicator analysis The XRP moving average lines are positioned above the price bars. XRP declines each time it is pushed back by the 21-day SMA barrier. Doji candlesticks have formed, leading to price consolidation. On the 4-hour chart, the price bars are below the horizontal moving average lines, indicating a downtrend. Technical indicators: What is the next direction for XRP? XRP is trading above the $1.80 support level and below the $2.30 peak. The price has fallen below the moving average lines, approaching the critical support level of $2.00. On December 1, the price retested the $2.00 support before pulling back. If XRP falls and remains above $2.00, it is expected to continue moving sideways. Disclaimer. This analysis and forecast are the personal opinions of the author. The data provided is collected by the author and is not sponsored by any company or token developer. This is not a recommendation to buy or sell cryptocurrency and should not be viewed as an endorsement by Coinidol.com. Readers should do their research before investing in funds. Source: https://coinidol.com/xrp-moves-sideways/
Share
BitcoinEthereumNews2025/12/06 05:31