

Binance Coin (BNB) Price Prediction 2026, 2027-2030
- Bullish BNB price prediction for 2026 is $1,085.67 to $1,385.51.
- Binance Coin (BNB) price might reach $2000 soon.
- Bearish BNB price prediction for 2026 is $671.51.
In this Binance Coin (BNB) price prediction 2026, 2027-2030, we will analyze the price patterns of BNB by using accurate trader-friendly technical analysis indicators and predict the future movement of the cryptocurrency.
|
TABLE OF CONTENTS
|
|
INTRODUCTION
|
|
|
BINANCE COIN (BNB) PRICE PREDICTION 2026
|
|
| Binance Coin (BNB) PRICE PREDICTION 2027, 2028-2030 |
| CONCLUSION |
| FAQ |
Binance Coin (BNB) Current Market Status
| Current Price | $902.24 |
| 24 – Hour Price Change | 1.68% Up |
| 24 – Hour Trading Volume | $1.88B |
| Market Cap | $124.26B |
| Circulating Supply | 137.73M BNB |
| All – Time High | $1,370.55 (On October 13, 2025) |
| All – Time Low | $0.09611 (On Aug 01, 2017) |
What is Binance Coin (BNB)
| TICKER | BNB |
| BLOCKCHAIN | Binance Chain |
| CATEGORY | Exchange |
| ORIGIN DATE | July, 2017 |
| UTILITIES | Governance, security, gas fees & rewards |
Binance Coin (BNB) was launched in 2017 as the utility token for Binance, one of the largest crypto exchanges. Initially, Binance Coin (BNB) was only used as transaction fees and trading fees on the exchange. Binance nearly holds the largest crypto trading volume of $7.6 billion at the beginning of Q2 2023.
Later in September 2020, Binance Smart Chain (BSC), an EVM-compatible Proof-of-Stake authority (PoSA) blockchain, went live. The exchange token migrated onto the BSC and its functionalities expanded. Recently, BNB hit a new all-time high on December 4, 2024.
Four.meme is a memecoin launch platform on the BNB Chain, launched in July 2024. It has enhanced the BNB Chain ecosystem by empowering traders, creators, and opportunists. The platform provides a decentralized space for users to launch and trade memecoins, offering the necessary tools for creators to monetize their projects. Four.meme leverages the BNB Chain’s speed, scalability, and low transaction costs to streamline the memecoin creation process, contributing to the growing memecoin sector.
Binance Coin 24H Technicals
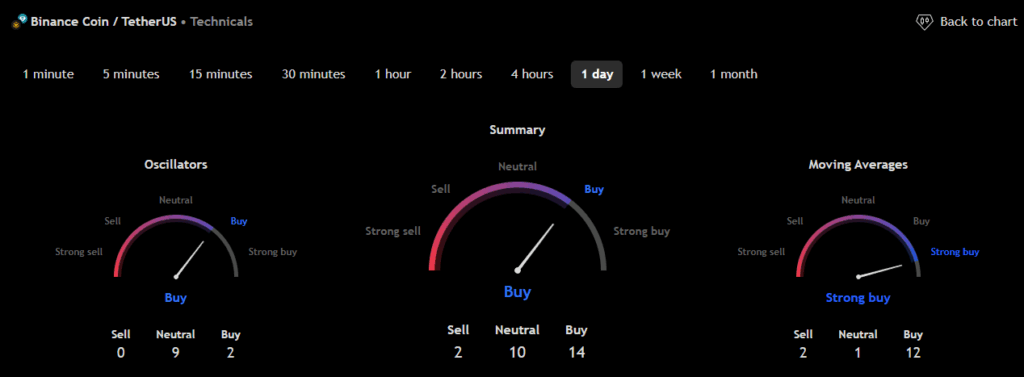 (Source: TradingView)
Binance Coin (BNB) Price Prediction 2026
Binance Coin (BNB) ranks 5th on CoinMarketCap in terms of its market capitalization. The overview of the Binance Coin price prediction for 2026 is explained below with a daily time frame.
BNB/USDT Horizontal Channel Pattern (Source: TradingView)
In the above chart, Binance Coin (BNB) laid out a Horizontal channel pattern. The Horizontal channel pattern is also known as the sideways trend. In general, the horizontal channel is formed during the price consolidation. In this pattern, the upper trendline, the line that connects the highs, and the lower trendline, the line that connects the lows, run horizontally parallel, and the price action is contained within it.
A horizontal channel is often regarded as one of the suitable patterns for timing the market, as the buying and selling points are in consolidation.
At the time of analysis, the price of Binance Coin (BNB) was recorded at $902.24. If the pattern trend continues, then the price of BNB might reach the resistance level of $1024.35, and $1178.34. If the trend reverses, then the price of BNB may fall to the support levels of $954.72, and $890.48.
Binance Coin (BNB) Resistance and Support Levels
The chart given below elucidates the possible resistance and support levels of Binance Coin (BNB) in 2026.
From the above chart, we can analyze and identify the following as resistance and support levels of Binance Coin (BNB) for 2026.
| Resistance Level 1 | $1,085.67 |
| Resistance Level 2 | $1,385.51 |
| Support Level 1 | $869.74 |
| Support Level 2 | $671.51 |
BNB Resistance & Support Levels
Binance Coin (BNB) Price Prediction 2026 — RVOL, MA, and RSI
The technical analysis indicators such as Relative Volume (RVOL), Moving Average (MA), and Relative Strength Index (RSI) of Binance Coin (BNB) are shown in the chart below.
From the readings on the chart above, we can make the following inferences regarding the current Binance Coin (BNB) market in 2026.
| INDICATOR | PURPOSE | READING | INFERENCE |
| 50-Day Moving Average (50MA) | Nature of the current trend by comparing the average price over 50 days | 50 MA = $1083.78Price = $927.05 (50MA> Price) |
Bullish/Uptrend |
| Relative Strength Index (RSI) | Magnitude of price change;Analyzing oversold & overbought conditions | 35.50 <30 = Oversold50-70 = Neutral>70 = Overbought |
Nearly Oversold |
| Relative Volume (RVOL) | Asset’s trading volume in relation to its recent average volumes | Below cutoff line | Weak volume |
Binance Coin (BNB) Price Prediction 2026 — ADX, RVI
In the below chart, we analyze the strength and volatility of Binance Coin (BNB) using the following technical analysis indicators — Average Directional Index (ADX) and Relative Volatility Index (RVI).
From the readings on the chart above, we can make the following inferences regarding the price momentum of Binance Coin (BNB).
| INDICATOR | PURPOSE | READING | INFERENCE |
| Average Directional Index (ADX) | Strength of the trend momentum | 38.16 | Strong Trend |
| Relative Volatility Index (RVI) | Volatility over a specific period | 46.25 <50 = Low >50 = High |
Low Volatility |
Comparison of BNB with BTC, ETH
Let us now compare the price movements of Binance Coin (BNB) with that of Bitcoin (BTC), and Ethereum (ETH).
From the above chart, we can interpret that the price action of BNB is similar to that of BTC and ETH. That is, when the price of BTC and ETH increases or decreases, the price of BNB also increases or decreases, respectively.
Binance Coin (BNB) Price Prediction 2027, 2028 – 2030
With the help of the aforementioned technical analysis indicators and trend patterns, let us predict the price of Binance Coin (BNB) between 2027, 2028, 2029 and 2030.
| Year | Bullish Price | Bearish Price |
| Binance Coin (BNB) Price Prediction 2027 | $2360 | $650 |
| Binance Coin (BNB) Price Prediction 2028 | $2600 | $600 |
| Binance Coin (BNB) Price Prediction 2029 | $2840 | $550 |
| Binance Coin (BNB) Price Prediction 2030 | $3080 | $500 |
Conclusion
If Binance Coin (BNB) establishes itself as a good investment in 2026, this year would be favorable to the cryptocurrency. In conclusion, the bullish Binance Coin (BNB) price prediction for 2026 is $1,385.51. Comparatively, if unfavorable sentiment is triggered, the bearish Binance Coin (BNB) price prediction for 2026 is $671.51.
If the market momentum and investors’ sentiment positively elevates, then Binance Coin (BNB) might hit $2000. Furthermore, with future upgrades and advancements in the Binance Coin ecosystem, BNB might surpass its current all-time high (ATH) of $1,370.55 and mark its new ATH.
FAQ
1. What is Binance Coin (BNB)?
Binance Coin (BNB) is an exchange-based token living on the Binance Smart Chain (BSC). Initially launched as the utility token for paying the exchange transaction and trading fees, BNB extended into an efficient payment and investment option.
2. Where can you purchase Binance Coin (BNB)?
Binance Coin (BNB) has been listed mostly on all crypto exchanges – from Binance, OKX, Deepcoin, Bybit, and Cointr Pro.
3. Will Binance Coin (BNB) reach a new ATH soon?
With the ongoing developments and upgrades within the Binance Coin platform, BNB has a high possibility of reaching its ATH soon.
4. What is the current all-time high (ATH) of Binance Coin (BNB)?
On October 13, 2025, Binance Coin (BNB) reached its new all-time high (ATH) of $1,370.55.
5. What is the lowest price of Binance Coin (BNB)?
According to CoinMarketCap, BNB hit its all-time low (ATL) of $0.09611 on Aug 01, 2017.
6. Will Binance Coin (BNB) reach $2000?
If the bullish trend continues and if Binance Coin (BNB) retests its resistance levels, it will hit $2000 soon.
7. What will be the Binance Coin (BNB) price by 2027?
Binance Coin (BNB) price is expected to reach $2360 by 2027.
8. What will be the Binance Coin (BNB) price by 2028?
Binance Coin (BNB) price is expected to reach $2600 by 2028.
9. What will be the Binance Coin (BNB) price by 2029?
Binance Coin (BNB) price is expected to reach $2840 by 2029.
10. What will be the Binance Coin (BNB) price by 2030?
Binance Coin (BNB) price is expected to reach $3080 by 2030.
Top Crypto Predictions
Neo (NEO) Price Prediction
KuCoin Token (KCS) Price Prediction
Maker (MKR) Price Prediction
Disclaimer: The opinion expressed in this article is solely the author’s. It does not represent any investment advice. TheNewsCrypto team encourages all to do their own research before investing.
You May Also Like

Firelight Hits 50 Million XRP Milestone as DeFi Protection Demand Surges – Crypto News Bitcoin News

How to earn from cloud mining: IeByte’s upgraded auto-cloud mining platform unlocks genuine passive earnings


