Chainlink (LINK) token was trading at $13.70, up modestly from the November low of $11.556. This price is well below the August high of $27.80.Chainlink (LINK) token was trading at $13.70, up modestly from the November low of $11.556. This price is well below the August high of $27.80.

Chainlink price set to surge as whales buy and exchange reserves fall

2025/12/09 22:48

Chainlink price has stalled in the past few days, even as its key fundamental metrics have improved.

Summary
  • Chainlink price has formed bullish patterns on the daily chart.
  • Whales have continued to accumulate the LINK tokens.
  • The supply of Chainlink tokens in exchanges has plunged.

Chainlink (LINK) token was trading at $13.70, up modestly from the November low of $11.556. This price is well below the August high of $27.80. 

Nansen data shows that whale investors have continued to accumulate the LINK token in the past few weeks. They now hold 3.9 million tokens, up from last month’s low of 1.77 million. 

Whales are large investors who, in most cases, are more experienced than ordinary retail traders. In most cases, their positioning is important as they usually buy low and exit high. 

Meanwhile, investors are actively moving LINK tokens out of exchanges, a sign of accumulation. There are now 219 million LINK tokens on exchanges, a significant drop from 324 million in October this year. 

Chainlink tokens are leaving exchanges as American investors continue buying LINK ETFs. Data shows that the recently launched Graycale Chainlink ETF has nearly $50 million in cumulative assets after its launch. 

At the same time, the Strategic LINK Reserve that was launched in August has already accumulated over 1 million tokens. The developers hope to keep accumulating these tokens using the money they generate on-chain and off-chain. 

Chainlink’s technology is seeing robust demand due to its market share in real-world asset tokenization and decentralized finance. 

Chainlink price technical analysis

Chainlink price set to surge as whales buy and exchange reserves fall - 2

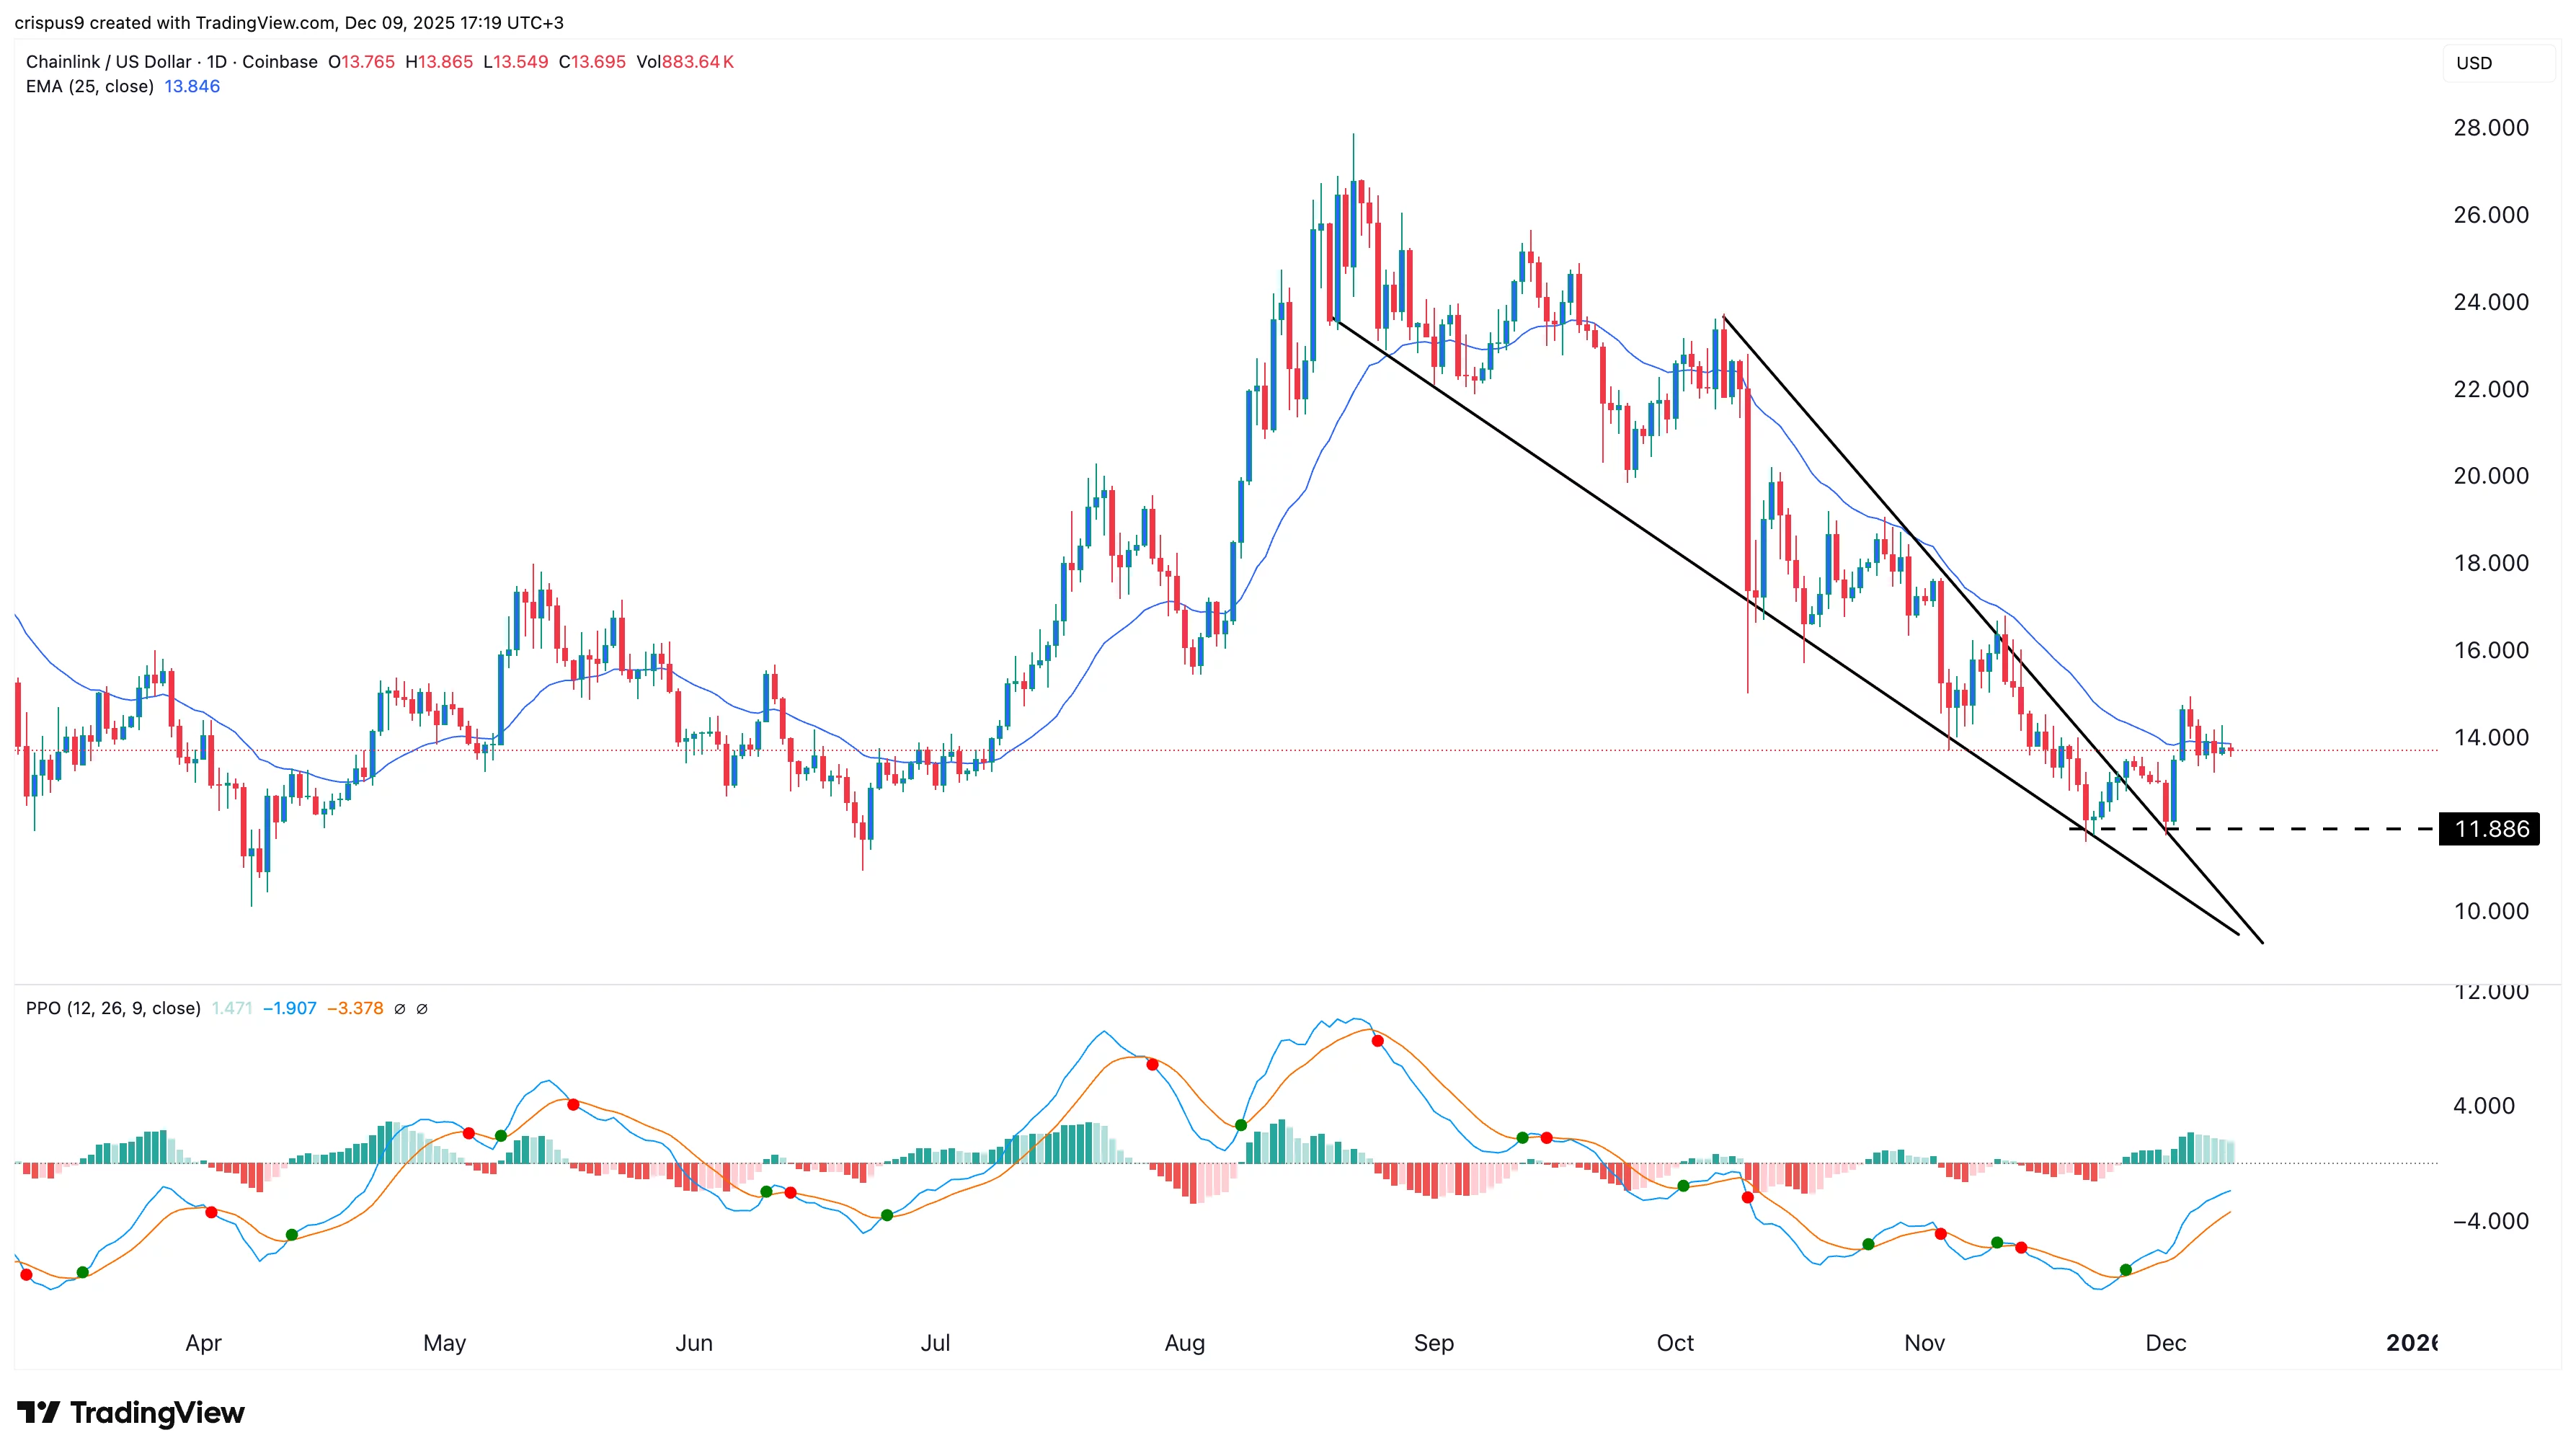
The daily chart points to a potential LINK price comeback in the coming days or weeks. It formed a small double-bottom pattern at $11.88 and a neckline at $13.65. It has now retested this level, and formed a small bullish flag pattern. 

Chainlink token has also formed a falling wedge pattern and is now above the lower side. At the same time, the Percentage Price Oscillator has continued rising, with the two lines nearing the zero line. 

LINK is also attempting to move above the 25-day Exponential Moving Average. Therefore, these technical indicators suggest the token will likely continue to rise as buyers target the psychological $20 level. This view will become invalid if it plunges below the support at $11.88.

Disclaimer: The articles reposted on this site are sourced from public platforms and are provided for informational purposes only. They do not necessarily reflect the views of MEXC. All rights remain with the original authors. If you believe any content infringes on third-party rights, please contact service@support.mexc.com for removal. MEXC makes no guarantees regarding the accuracy, completeness, or timeliness of the content and is not responsible for any actions taken based on the information provided. The content does not constitute financial, legal, or other professional advice, nor should it be considered a recommendation or endorsement by MEXC.

You May Also Like

Edges higher ahead of BoC-Fed policy outcome

Edges higher ahead of BoC-Fed policy outcome

The post Edges higher ahead of BoC-Fed policy outcome appeared on BitcoinEthereumNews.com. USD/CAD gains marginally to near 1.3760 ahead of monetary policy announcements by the Fed and the BoC. Both the Fed and the BoC are expected to lower interest rates. USD/CAD forms a Head and Shoulder chart pattern. The USD/CAD pair ticks up to near 1.3760 during the late European session on Wednesday. The Loonie pair gains marginally ahead of monetary policy outcomes by the Bank of Canada (BoC) and the Federal Reserve (Fed) during New York trading hours. Both the BoC and the Fed are expected to cut interest rates amid mounting labor market conditions in their respective economies. Inflationary pressures in the Canadian economy have cooled down, emerging as another reason behind the BoC’s dovish expectations. However, the Fed is expected to start the monetary-easing campaign despite the United States (US) inflation remaining higher. Investors will closely monitor press conferences from both Fed Chair Jerome Powell and BoC Governor Tiff Macklem to get cues about whether there will be more interest rate cuts in the remainder of the year. According to analysts from Barclays, the Fed’s latest median projections for interest rates are likely to call for three interest rate cuts by 2025. Ahead of the Fed’s monetary policy, the US Dollar Index (DXY), which tracks the Greenback’s value against six major currencies, holds onto Tuesday’s losses near 96.60. USD/CAD forms a Head and Shoulder chart pattern, which indicates a bearish reversal. The neckline of the above-mentioned chart pattern is plotted near 1.3715. The near-term trend of the pair remains bearish as it stays below the 20-day Exponential Moving Average (EMA), which trades around 1.3800. The 14-day Relative Strength Index (RSI) slides to near 40.00. A fresh bearish momentum would emerge if the RSI falls below that level. Going forward, the asset could slide towards the round level of…
Share
BitcoinEthereumNews2025/09/18 01:23