XRP price compresses into triangle pattern, breakout odds to $2.20 rises
XRP price continues to compress inside a tightening triangle pattern, increasing the probability of a major breakout as price approaches the apex between key support and resistance levels.
- XRP’s trading range is tightening, hinting that a major move is approaching.
- Market attention is building as price hovers near a crucial decision point.
- A surge in trading activity could determine whether XRP trends higher or breaks lower.
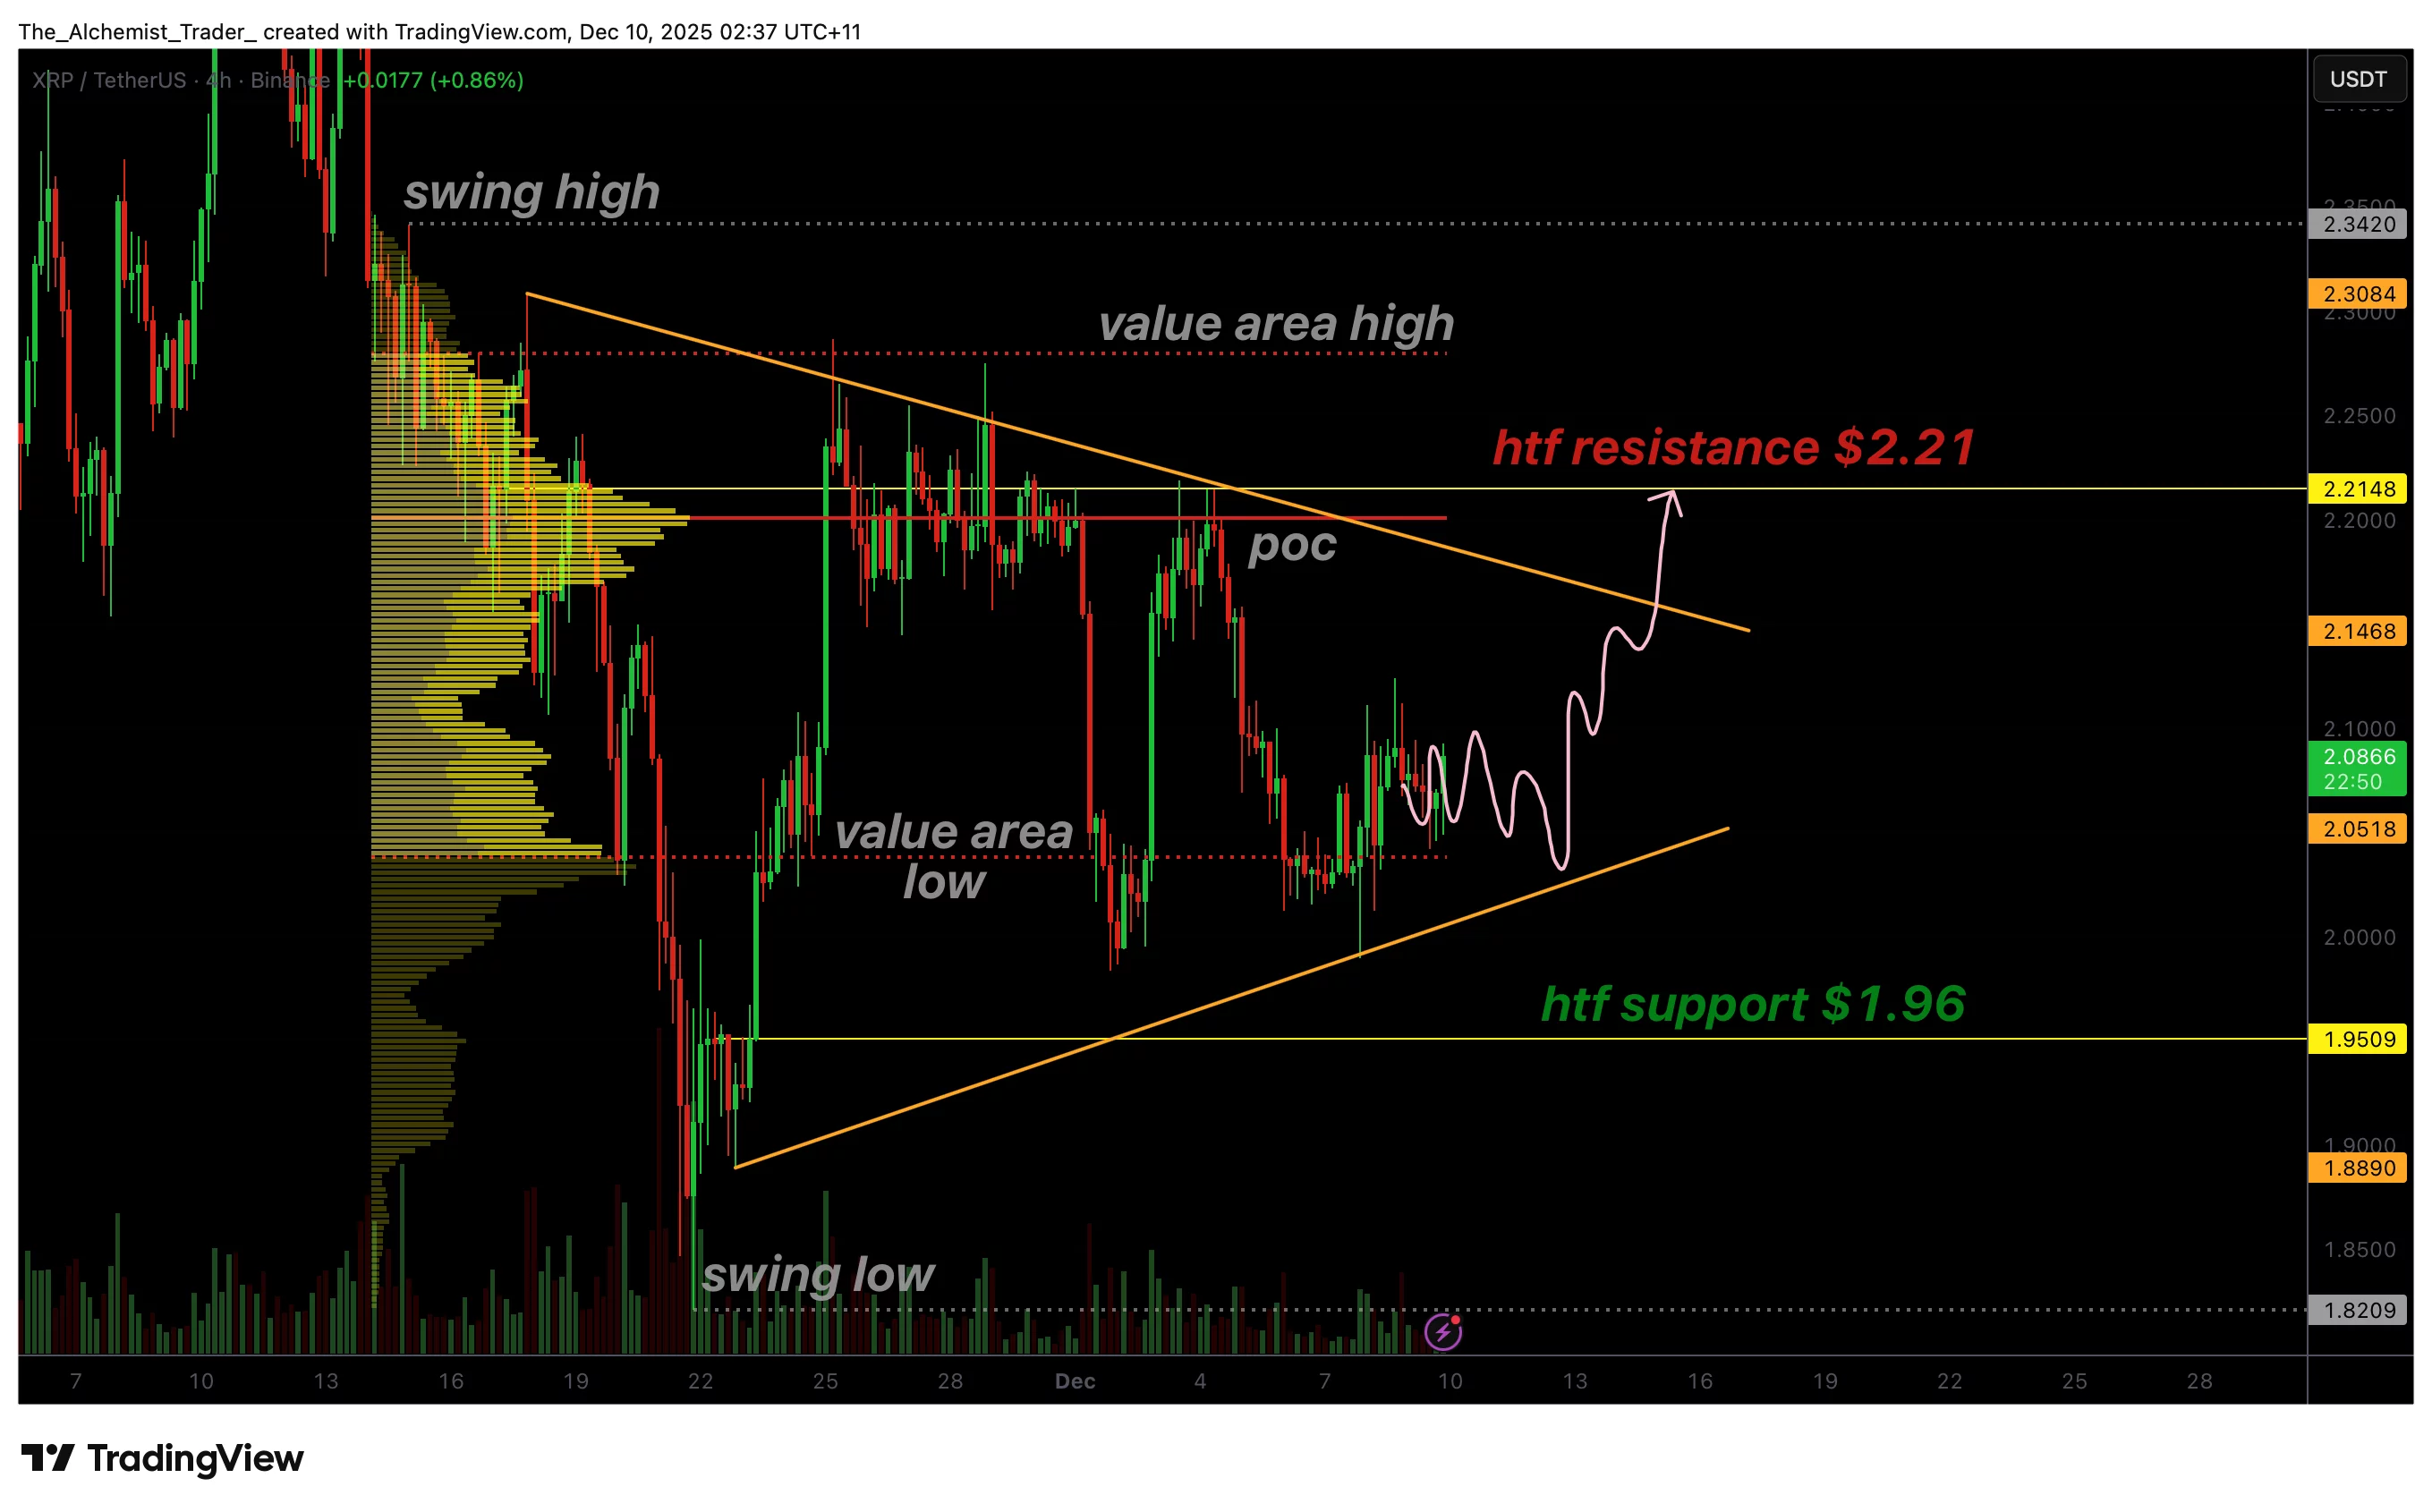
XRP (XRP) price is showing one of its clearest structural patterns in months as price compresses into a multi-week symmetrical triangle. With higher lows forming beneath lower highs, the asset is now coiling into a decisive apex zone where volatility is expected to expand sharply.
As the market waits for confirmation of the next major move, traders and analysts alike are closely monitoring volume behaviour and structural reactions around XRP’s key support and resistance levels. The potential for a breakout toward $2.20 is increasing, but confirmation remains essential.
XRP price key technical points
- XRP is forming a symmetrical triangle with clear higher lows and lower highs.
- The Point of Control (POC) and the $2.20 resistance mark the key structural ceiling.
- Triangle compression suggests a volatility expansion is approaching, but volume confirmation is still absent.
The current XRP price structure is defined by textbook compression within a large triangle formation. This pattern has emerged after several months of oscillating price action, producing consecutive higher lows that show accumulating demand, while lower highs demonstrate consistent resistance.
These converging trendlines now lead into a narrowing apex, a structure that typically precedes a high-momentum breakout. With XRP’s velocity recently spiking alongside renewed interest sparked by Ripple’s large capital movements, market behavior is becoming increasingly reactive as traders anticipate what comes next.
XRP is currently trading near the base of the triangle support zone. This area has repeatedly acted as a reactive floor, preventing deeper breakdowns and keeping the broader consolidation intact. As price approaches the apex, the upper boundary becomes increasingly important, the region between the Point of Control and the $2.20 high-time-frame resistance.
A decisive break above this zone would signal a powerful bullish expansion and could open the door to a retest of higher resistances beyond the $2.20 threshold.
Another factor to consider is the nature of consolidation itself. When assets compress inside a tightening range, the duration of the consolidation can extend longer than expected. XRP may continue trading inside the triangle for several more days, or even weeks, while the market accumulates order flow. This slow compression is not inherently bearish; instead, it often supports the development of a stronger eventual breakout by building stored energy within the pattern.
The interplay between these levels will determine whether XRP’s next move is an upside breakout or a downside continuation, especially as wider market attention grows, with milestones such as the XRP ETF surpassing $1 billion in assets and CLS mining showcasing daily yield potential of up to $8,700, adding further momentum and visibility to XRP’s broader ecosystem.
Even though the formation leans symmetrically neutral, the presence of higher lows suggests underlying strength. If buyers continue defending the triangle base while volume gradually increases, the probability of a bullish resolution becomes increasingly favorable.
What to Expect in the Coming Price Action
XRP is nearing a decisive moment. A breakout above the $2.20 resistance, confirmed by strong volume, would signal a bullish continuation targeting higher structural levels. Conversely, a breakdown beneath $1.96 would invalidate the triangle and open the door to further downside. Until then, XRP is expected to remain within the compression zone as the market builds pressure for its next major move.
You May Also Like

Russia’s Central Bank Prepares Crackdown on Crypto in New 2026–2028 Strategy

IMX Technical Analysis Mar 27