

Ethereum Sees Largest Binance Inflow Since 2023 – Warning Sign?
Ethereum has spent the past several days consolidating in a tight range between $3,000 and $3,200, signaling a moment of hesitation as the broader market struggles to find direction. Despite attempts to push higher, momentum has flattened, and uncertainty continues to dominate sentiment. Many analysts now warn that Ethereum may be entering a deeper bearish phase, pointing to weakening spot demand, fragile market structure, and fading optimism across major exchanges.
However, one on-chain development has captured the market’s attention. According to new data from CryptoQuant, December 5, 2025 saw a massive spike in Ethereum Exchange Netflow to Binance, marking one of the largest daily inflows in years. Such a surge typically raises questions about investor intentions: large inflows often signal that holders are moving ETH onto exchanges with the potential to sell, increasing the probability of short-term volatility or downside pressure.
Yet the broader context matters. Ethereum’s price remains above key support, suggesting that the market is in a critical decision zone rather than a confirmed breakdown. This combination of consolidation, rising caution, and an unusually large exchange inflow sets the stage for what could become a pivotal moment for ETH as traders prepare for the next major move.
Massive Netflow Surge Raises Caution for Ethereum
According to data from CryptoOnchain shared on CryptoQuant, Ethereum experienced a striking shift in exchange activity on December 5, 2025. The netflow to Binance reached 162,084 ETH while the price hovered near $3,021, marking the largest daily positive netflow since May 2023. Such an influx is significant, not only because of its size but because of what it typically signals: a rise in the number of investors moving ETH from self-custody to exchanges.

Historically, large positive netflows are interpreted as potentially bearish, suggesting that holders may be preparing to sell or rebalance. When deposits drastically outweigh withdrawals, it can precede heightened selling pressure, especially when the market is already in a fragile state. Inflows of this magnitude can act as a temporary supply shock; if even a portion of this ETH hits the order books as market sells, the price could face increased volatility or short-term corrective pressure.
Because of this, traders should closely monitor how Binance absorbs this liquidity. Watching order book depth, open interest reactions, and subsequent netflow patterns will reveal whether this was a one-off spike or the beginning of a broader shift in investor behavior. In a market this delicate, even a single inflow event can set the tone for the days ahead.
ETH Price Attempts Stabilization
Ethereum’s daily chart shows a market in the process of stabilizing, but still weighed down by significant structural resistance. After dipping below $2,800 in late November, ETH has managed to reclaim the $3,100 region, where it has been consolidating for several days. This range-bound behavior signals a pause in the prior downtrend, yet the recovery lacks the strong momentum typically seen in bullish reversals.
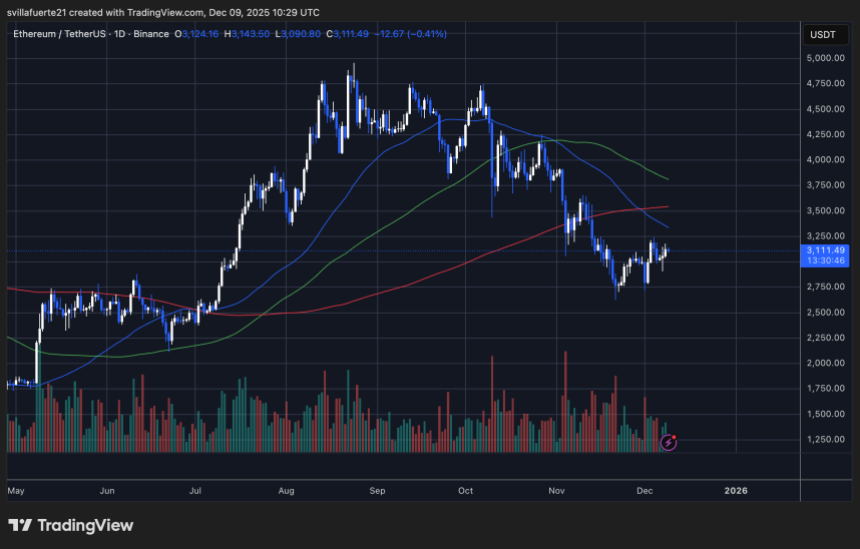
The 50-day and 100-day moving averages remain positioned above the current price, forming a clear zone of resistance between $3,250 and $3,500. These declining MAs highlight that the broader trend still favors sellers, and ETH will need a decisive breakout above them to shift market sentiment. The 200-day MA, sitting higher, reinforces the idea that Ethereum is still trading below its long-term trend structure.
Volume has also weakened during this rebound, suggesting that buyers are hesitant to commit aggressively at current levels. The recent spike in exchange netflows adds another layer of caution, raising the possibility of increased near-term selling pressure.
ETH is showing early signs of stabilization, but the path forward requires stronger conviction. Until price breaks above the cluster of moving averages, this recovery remains fragile and vulnerable to renewed downside pressure.
Featured image from ChatGPT, chart from TradingView.com


You May Also Like

Not a loophole: Singapore AI export controls let China tap US AI legally

Bitcoin, Gold, and U.S. Stocks Dive as Trump Pledges to Hit Iran ‘Extremely Hard’

Crypto Market Drops as Fear Grows and Major Assets Decline


