

Aptos (APT) Price Prediction 2026, 2027-2030
- Bullish APT price prediction for 2026 is $1.320 to $2.059.
- Aptos (APT) price might reach $5 soon.
- Bearish APT price prediction for 2026 is $0.546.
In this Aptos (APT) price prediction 2026, 2027-2030, we will analyze the price patterns of APT by using accurate trader-friendly technical analysis indicators and predict the future movement of the cryptocurrency.
|
TABLE OF CONTENTS
|
|
INTRODUCTION
|
|
|
APTOS (APT) PRICE PREDICTION 2026
|
|
| APTOS (APT) PRICE PREDICTION 2027, 2028-2030 |
| CONCLUSION |
| FAQ |
Aptos (APT) Current Market Status
| Current Price | $1.01 |
| 24 – Hour Price Change | 5.03% Up |
| 24 – Hour Trading Volume | $147.22M |
| Market Cap | $790.2M |
| Circulating Supply | 750.43M APT |
| All – Time High | $19.90 (Jan 30, 2023) |
| All – Time Low | $0.7926 (On Feb 23, 2026) |
What is Aptos (APT)
| TICKER | APT |
| BLOCKCHAIN | Aptos blockchain |
| CATEGORY | Public blockchain platform |
| LAUNCHED ON | October 2022 |
| UTILITIES | Governance, Fast Transactions, gas fees & rewards |
APT is the native crypto token of the Aptos blockchain. Aptos is a layer-one blockchain that was developed by Aptos Labs. The Aptos mainnet was launched on October 17, 2022, by Aptos Labs. The Aptos network uses a proof-of-stake (PoS) consensus algorithm, which requires validators to have a minimum amount of staked Aptos tokens in order to participate in transaction validation.
Aptos 24H Technicals
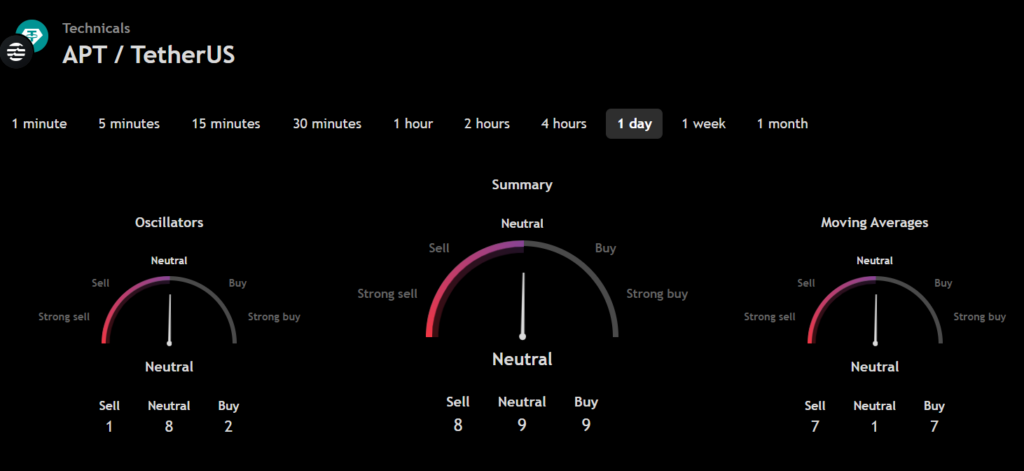 (Source: TradingView)
Aptos (APT) Price Prediction 2026
Aptos (APT) ranks 63rd on CoinMarketCap in terms of its market capitalization. The overview of the Aptos price prediction for 2026 is explained below with a daily time frame.
In the above chart, Aptos (APT) laid out a Rounding Bottom pattern. The price movements form a pattern that resembles a bow and hence is also known as the saucer bottom pattern. In general, the rounding bottom pattern indicates a long-term price reversal. This pattern also emphasizes the changes in the market sentiment as the trend seems to shift from bearish to bullish.
Investors generally have to stay cautious and time the market well. If the price breaks and moves past the resistance level, it will enter a confirmed bullish trajectory.
At the time of analysis, the price of Aptos (APT) was recorded at $1. If the pattern trend continues, then the price of APT might reach the resistance levels of $1.105 and $1.483. If the trend reverses, then the price of APT may fall to the support of $0.919 and $0.785.
Aptos (APT) Resistance and Support Levels
The chart given below elucidates the possible resistance and support levels of Aptos (APT) in 2026
From the above chart, we can analyze and identify the following as resistance and support levels of Aptos (APT) for 2026.
| Resistance Level 1 | $1.320 |
| Resistance Level 2 | $2.059 |
| Support Level 1 | $0.793 |
| Support Level 2 | $0.546 |
Aptos (APT) Price Prediction 2026 — RVOL, MA, and RSI
The technical analysis indicators such as Relative Volume (RVOL), Moving Average (MA), and Relative Strength Index (RSI) of Bitcoin (APT) are shown in the chart below.
From the readings on the chart above, we can make the following inferences regarding the current Aptos (APT) market in 2026.
| INDICATOR | PURPOSE | READING | INFERENCE |
| 50-Day Moving Average (50MA) | Nature of the current trend by comparing the average price over 50 days | 50 MA = $1.225 Price = $1.006 (50MA > Price) |
Bearish/Downtrend |
| Relative Strength Index (RSI) | Magnitude of price change;Analyzing oversold & overbought conditions | 48.587 <30 = Oversold 50-70 = Neutral >70 = Overbought |
Nearly Oversold |
| Relative Volume (RVOL) | Asset’s trading volume in relation to its recent average volumes | Below cutoff line | Weak volume |
Aptos (APT) Price Prediction 2026 — ADX, RVI
In the below chart, we analyze the strength and volatility of Aptos (APT) using the following technical analysis indicators — Average Directional Index (ADX) and Relative Volatility Index (RVI).
From the readings on the chart above, we can make the following inferences regarding the price momentum of Aptos (APT).
| INDICATOR | PURPOSE | READING | INFERENCE |
| Average Directional Index (ADX) | Strength of the trend momentum | 31.240 | Strong Trend |
| Relative Volatility Index (RVI) | Volatility over a specific period | 44.23 <50 = Low >50 = High |
Low Volatility |
Comparison of APT with BTC, ETH
Let us now compare the price movements of Aptos (APT) with that of Bitcoin (BTC), and Ethereum (ETH).
From the above chart, we can interpret that the price action of APT is similar to that of BTC and ETH. That is, when the price of BTC and ETH increases or decreases, the price of APT also increases or decreases respectively.
Aptos (APT) Price Prediction 2027, 2028 – 2030
With the help of the aforementioned technical analysis indicators and trend patterns, let us predict the price of Aptos (APT) between 2027, 2028, 2029, and 2030.
| Year | Bullish Price | Bearish Price |
| Aptos (APT) Price Prediction 2027 | $9 | $0.7 |
| Aptos (APT) Price Prediction 2028 | $11 | $0.5 |
| Aptos (APT) Price Prediction 2029 | $13 | $0.3 |
| Aptos (APT) Price Prediction 2030 | $15 | $0.1 |
Conclusion
If Aptos (APT) establishes itself as a good investment in 2026, this year would be favorable to the cryptocurrency. In conclusion, the bullish Aptos (APT) price prediction for 2026 is $2.059. Comparatively, if unfavorable sentiment is triggered, the bearish Aptos (APT) price prediction for 2026 is $0.546.
If the market momentum and investors’ sentiment positively elevate, then Aptos (APT) might hit $5. Furthermore, with future upgrades and advancements in the Aptos ecosystem, APT might surpass its current all-time high (ATH) of $19.90 and mark its new ATH.
FAQ
1. What is Aptos (APT)?
APT is the native crypto token of the Aptos blockchain. Aptos is a layer-one blockchain that was developed by Aptos Labs.
2. Where can you buy Aptos (APT)?
Traders can trade Aptos (APT) on the following cryptocurrency exchanges such as Binance, OKX, Bybit, CoinTR Pro, and DigiFinex.
3. Will Aptos (APT) record a new ATH soon?
With the ongoing developments and upgrades within the Aptos platform, Aptos (APT) has a high possibility of reaching its ATH soon.
4. What is the current all-time high (ATH) of Aptos (APT)?
Aptos (APT) hit its current all-time high (ATH) of $19.90 on January 30, 2023.
5. What is the lowest price of Aptos (APT)?
According to CoinMarketCap, APT hit its all-time low (ATL) of $0.7926 on Feb 23, 2026.
6. Will Aptos (APT) hit $20?
If Aptos (APT) becomes one of the active cryptocurrencies that majorly maintain a bullish trend, it might rally to hit $20 soon.
7. What will be the Aptos (APT) price by 2027?
Aptos (APT) price might reach $9 by 2027.
8. What will be the Aptos (APT) price by 2028?
Aptos (APT) price might reach $11 by 2028.
9. What will be the Aptos (APT) price by 2029?
Aptos (APT) price might reach $13 by 2029.
10. What will be the Aptos (APT) price by 2030?
Aptos (APT) price might reach $15 by 2030.
Top Crypto Predictions
Hedera (HBAR) Price Prediction
Filecoin (FIL) Price Prediction
Litecoin (LTC) Price Prediction
Disclaimer: The opinion expressed in this article is solely the author’s. It does not represent any investment advice. TheNewsCrypto team encourages all to do their own research before investing.


You May Also Like

Pi Network Issues Urgent Protocol 23 Warning to Node Operators

Hyperliquid Policy Center Praises SEC Chair Atkins’ On-Chain Agenda Featuring 4 Key Proposals


