

XRP Risks Double-Top Crash Toward $0.40, Peter Brandt Warns
Veteran chartist Peter Brandt is flagging what he calls a “potential double top” on XRP’s weekly chart, a classic reversal setup that, if confirmed, would argue for materially lower prices — even as other traders point to a washed-out weekly RSI reading that has historically aligned with prior bottom zones.
Peter Brandt Flags XRP Double Top Pattern
Brandt posted the chart to X on Dec. 17 and didn’t bother softening the message for XRP’s online faithful. “I know in advance that all you Riplosts $XRP will forever remind me of this post — ask me if I care,” he wrote, before adding: “This is a potential double top. Sure, it may fail, and I will deal with this if it does. But for now this has bearish implications. Love it or not — you need to deal with it.”
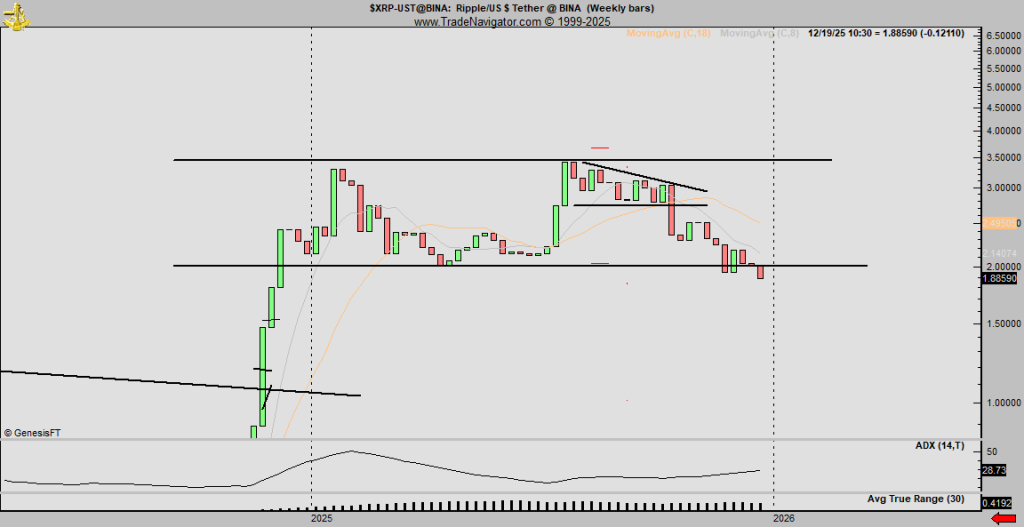
The chart shows XRP-USDT on Binance in weekly bars, with two highs clustered around $3.40 and $3.66 and a clearly marked support shelf near $2.00. In classical chart terms, that $2 region functions as the neckline: lose it with follow-through, and the market is no longer in “pullback inside a range” territory — it’s in “failed structure” territory.
That distinction matters because double tops tend to be less about the second peak itself and more about what happens at the midpoint low between the two peaks. Brandt’s framing reflects that: the pattern is “potential” until either support holds and price reclaims prior levels, or the neckline breaks and the market accepts lower.
In this case, Brandt’s chart is already showing XRP trading below the $2.00 line, with the most recent marker around $1.8859. That puts the focus squarely on whether the breakdown becomes a sustained weekly close-and-hold below support, or whether the move gets reversed quickly enough to treat it as a bear trap.
Or Is The XRP Bottom In?
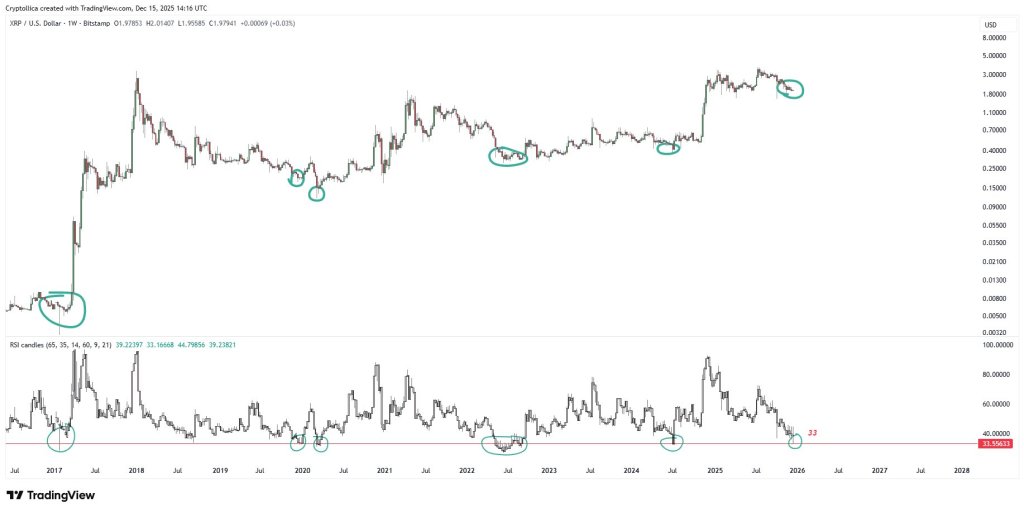
Not everyone reading the same tape is leaning into the bearish conclusion. Trader Cryptollica posted a separate XRP/USD weekly chart (Bitstamp) on Dec. 15 highlighting the weekly RSI at roughly 33, accompanied by the comment: “$XRP WEEKLY RSI : 33  ”. The chart highlights that, in the past five cases, similarly low readings in XRP’s weekly RSI have tended to occur around market bottoming zones.
Brandt was receptive to the conditional logic — specifically, the idea that a failed double top can flip from bearish to bullish if the breakdown doesn’t stick. Responding, he wrote: “Yea, if this dbl top fails then this could become exciting. I agree. I am not championing a bear case — just showing charts for what they are.”
That exchange captures the actual tension here. Momentum measures like RSI can identify stretched conditions and recurring historical zones, but they do not, on their own, invalidate a price-structure breakdown.
Notably, Brandt did not provide a price target in his comment. But the chart he shared contains enough structure to infer the standard “textbook” projection many technicians would use. With peaks near $3.60 and a neckline near $2.00, the pattern height is about $1.60. The conventional measured move subtracts that height from the neckline after a break, implying a target in the neighborhood of $0.40 if the setup fully plays out.
That is not a forecast, and it’s not a promise the market will cooperate — it’s simply the arithmetic implied by the pattern Brandt is pointing at. The more immediate question is whether XRP can reclaim the $2.00 area decisively enough to turn the breakdown into a failed move. If it can’t, the chart conversation shifts from “potential double top” to “confirmed break,” and the downside math stops being hypothetical in traders’ positioning models.
At press time, XRP traded at $1.83.


You May Also Like

Not a loophole: Singapore AI export controls let China tap US AI legally

Exclusive interview with Smokey The Bera, co-founder of Berachain: How the innovative PoL public chain solves the liquidity problem and may be launched in a few months

Rivian (RIVN) Tops Q1 Delivery Forecasts With R2 Launch Just Weeks Away


