

Ethereum price enters a low-risk phase as open interest falls 50% since August
Ethereum price appears to be consolidating after months of leverage exited the market, easing pressure without yet pointing to a clear direction.
- Ethereum open interest has fallen about 50% since August, showing widespread position closures by large traders.
- Binance taker sell volume has dropped to its lowest level since May, pointing to softer sell-side urgency.
- The chart shows sideways movement below key resistance, with buyers cautious and sellers less aggressive.
Ethereum is trading in a calmer market environment after a sharp reduction in leverage, with data showing that open interest across major exchanges has fallen since August.
According to a Dec. 21 post on X by analytics firm Alpharectal, Ethereum’s total open interest now stands at roughly 50% of its summer peak. Open interest refers to the total value of active futures and perpetual contracts.
When it rises, leverage builds up. When it falls, traders are closing positions, and risk in the system comes down.
Binance currently holds the largest share of ETH open interest, at about $7.6 billion, followed by Gate.io and HTX. This change indicates that excessive leverage is no longer stretching the market, which often lessens the possibility of abrupt price swings caused by liquidation.
While lower open interest usually limits short-term volatility, it can also create the conditions for a larger move later. In past cycles, similar resets have appeared either before another leg lower or ahead of a more stable recovery phase.
Selling pressure cools as leverage clears out
Further data support the idea that downside pressure is easing. A Dec. 22 analysis by CryptoQuant contributor CryptoOnchain shows that Ethereum taker sell volume on Binance has dropped to its lowest level since May. Taker sell volume tracks how much ETH is being sold at the market price, which reflects aggressive selling.
It appears that fewer traders are rushing to exit their positions, as the 30-day average has dropped to about $6.3 billion. This indicates that sellers are no longer controlling price action as they did during the recent selloff, but it does not imply that buyers have taken over.
This kind of setup often results in price stabilization as opposed to an immediate rally. For a stronger upside case, buyers would need to return with higher volume and rising open interest.
Ethereum price technical analysis
The daily chart shows Ethereum price stuck in a clear downtrend, marked by lower highs and lower lows. After a sharp drop, the price has moved sideways, hovering between roughly $2,800 and $3,300. This range appears to be acting as a decision zone.
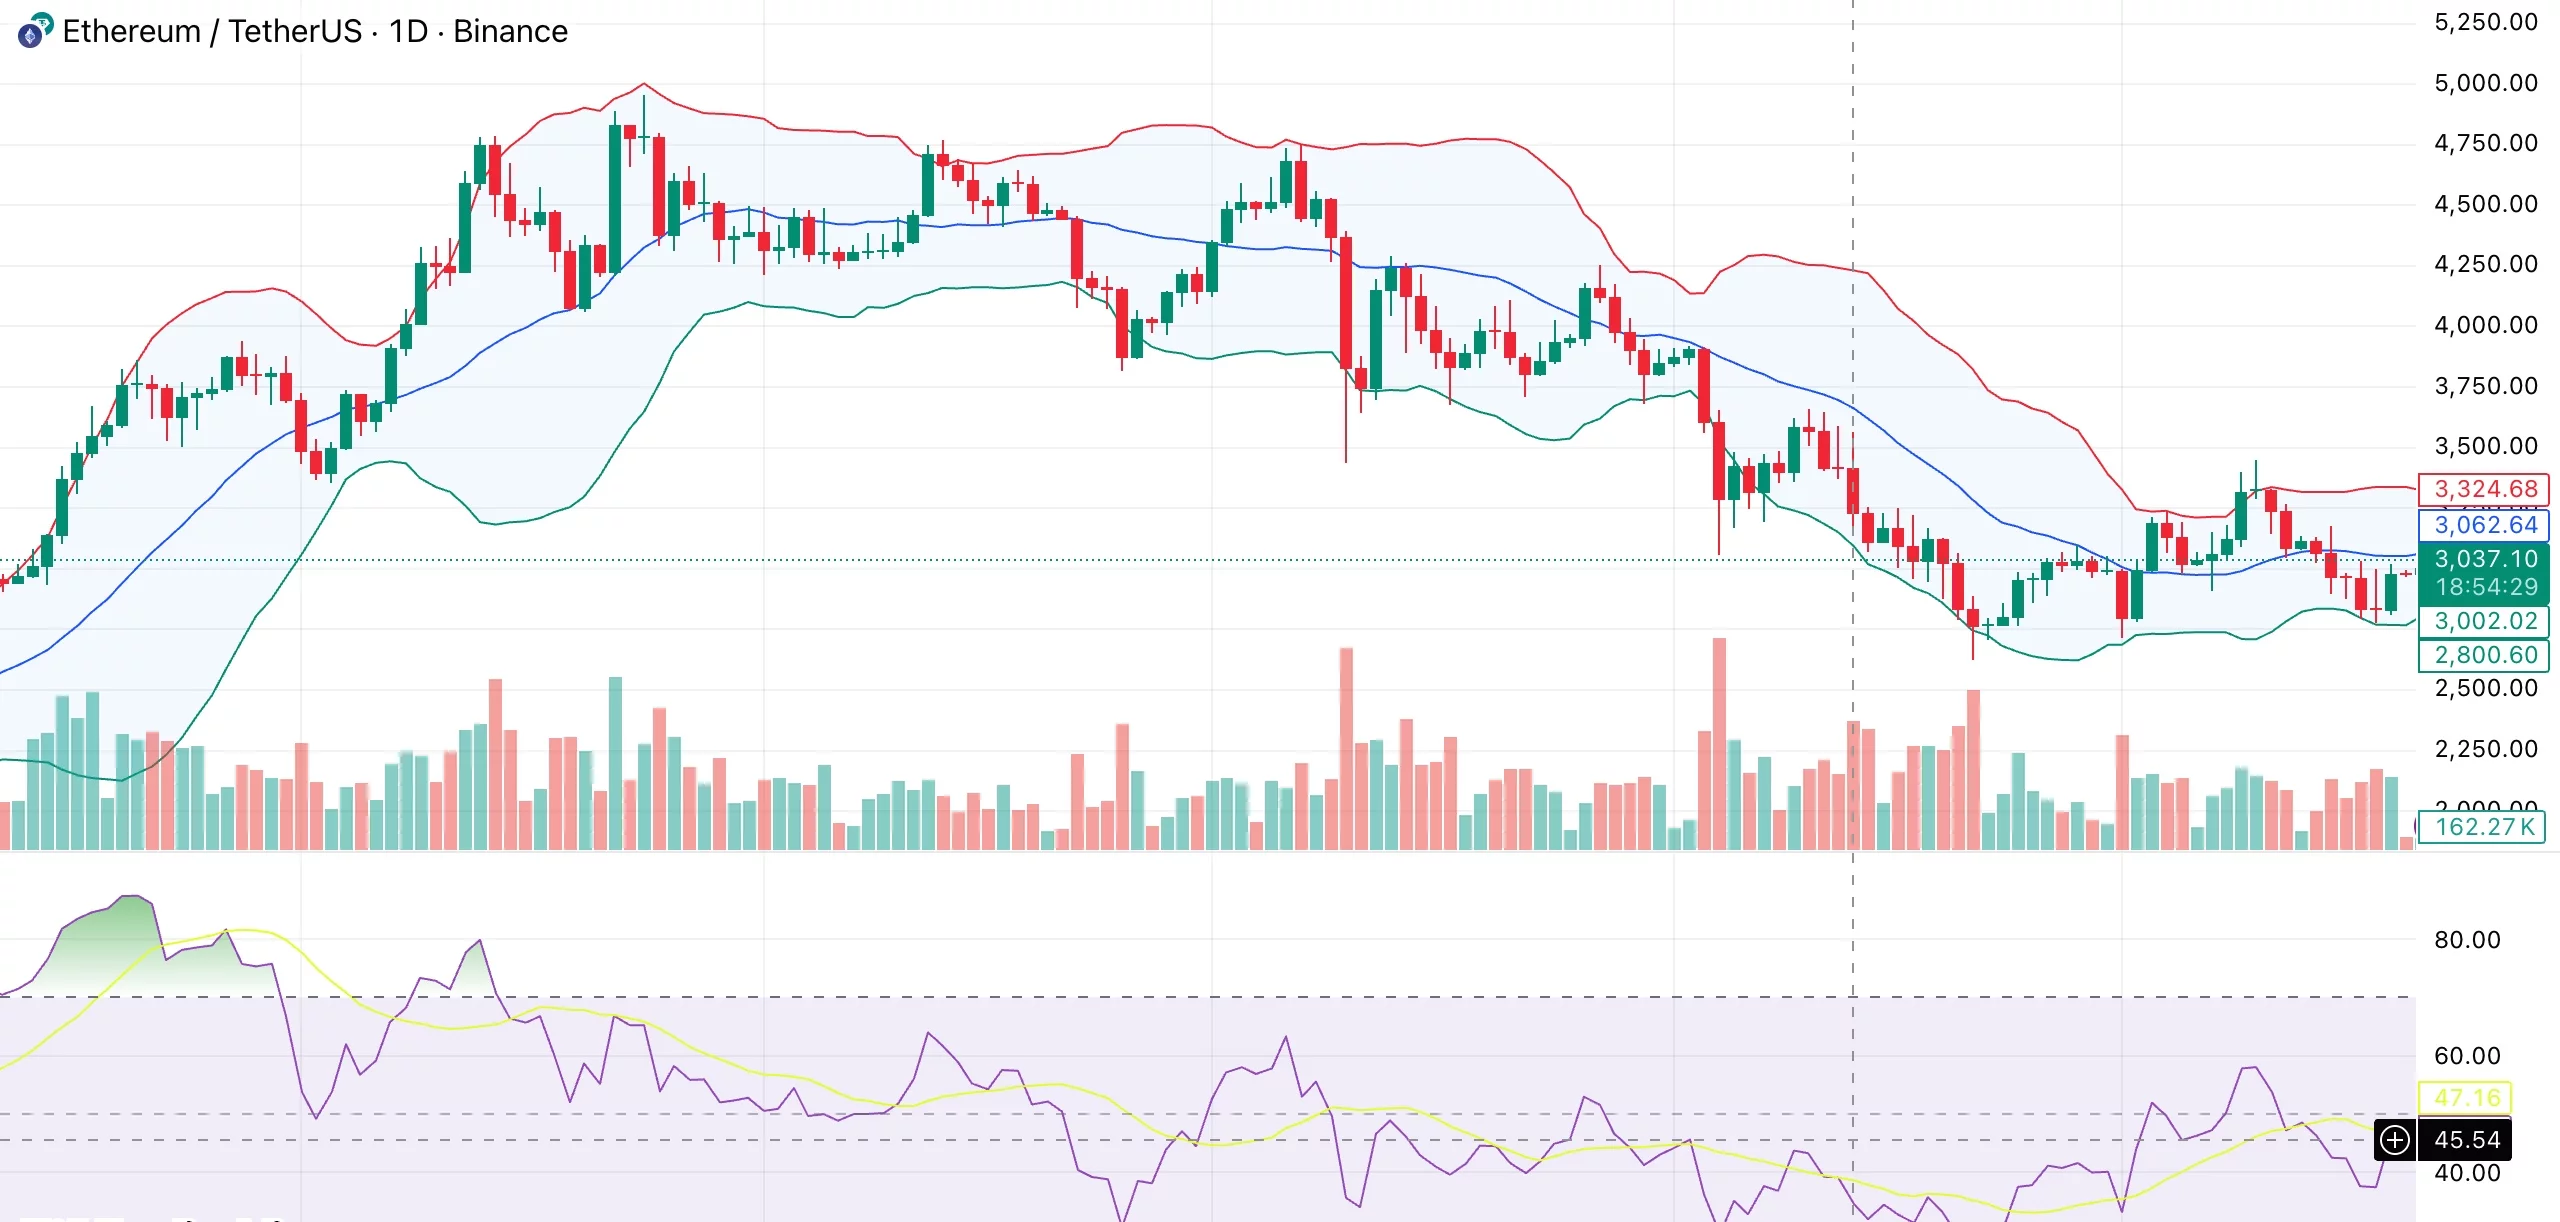
The short-term moving average continues to slope lower and sits above the price, which keeps pressure on any bounce. Attempts to push back above it have failed so far.
Bollinger Bands, which expanded during the sell-off, are now tightening. This often happens when volatility fades and the market pauses before its next move.
Volume data matches this picture. Heavy selling came in during the breakdown, but recent sessions show lighter and mixed volume. Sellers are less aggressive, yet buyers have not stepped in with conviction.
Momentum indicators paint a similar picture. After recovering from oversold levels, the relative strength index is currently slightly below 50. This does not confirm a change in the trend, but it does allow for a brief rebound.
Longer-term moving averages are still strongly negative, while MACD and short-term momentum indicators have a slight positive tilt.
A daily close above the moving average near the $3,300–$3,500 area, paired with stronger volume and RSI holding above 50, would improve the bullish case. On the downside, a clean break below the $2,800–$3,000 support zone could reopen the path to another sell-off.


You May Also Like

Why Businesses Need Professional Machine Design and Development Services

OKX Wallet Collaborates With GoPlus Security To Power Safeguards of Web3 Multi-Chain Applications With Decentralized Security


