XRP price failed to surpass $1.950 and started another decline. The price is now correcting gains and might struggle to stay above $1.850. XRP price started a downsideXRP price failed to surpass $1.950 and started another decline. The price is now correcting gains and might struggle to stay above $1.850. XRP price started a downside

XRP Price Slides Under Support, Bearish Continuation Signals Emerge

2025/12/24 12:48
2 min read
For feedback or concerns regarding this content, please contact us at crypto.news@mexc.com

XRP price failed to surpass $1.950 and started another decline. The price is now correcting gains and might struggle to stay above $1.850.

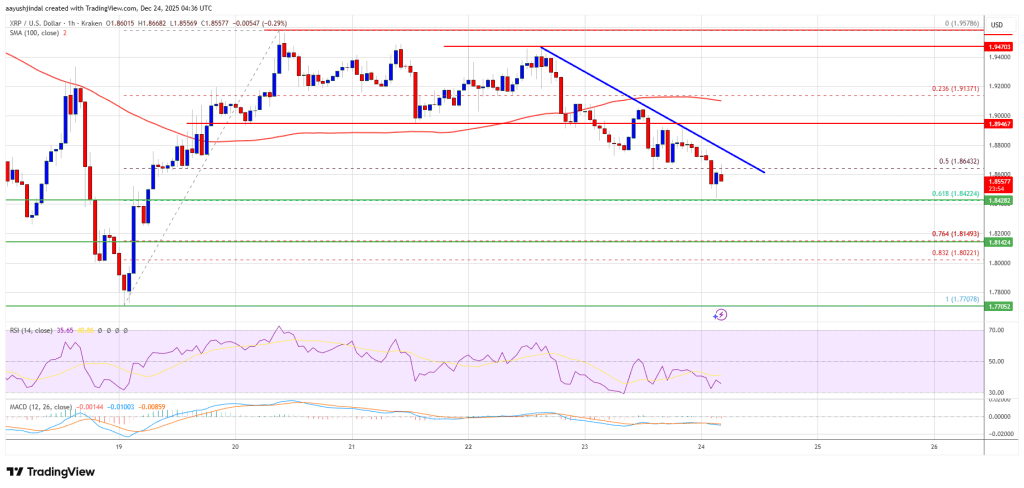
  • XRP price started a downside correction and tested the $1.850 zone.
  • The price is now trading below $1.880 and the 100-hourly Simple Moving Average.
  • There is a new bearish trend line forming with resistance at $1.870 on the hourly chart of the XRP/USD pair (data source from Kraken).
  • The pair could start another increase if it clears $1.90.

XRP Price Starts Fresh Decline

XRP price started a downside correction below the $1.9350 zone, like Bitcoin and Ethereum. The price dipped below the $1.90 and $1.880 levels to enter a negative zone.

The price even dipped below the 50% Fib retracement level of the upward move from the $1.770 swing low to the $1.9578 high. Besides, there is a new bearish trend line forming with resistance at $1.870 on the hourly chart of the XRP/USD pair.

The price is now trading below $1.880 and the 100-hourly Simple Moving Average. If there is a fresh upward move, the price might face resistance near the $1.870 level and the trend line. The first major resistance is near the $1.880 level, above which the price could rise and test $1.90.

XRP Price

A clear move above the $1.90 resistance might send the price toward the $1.950 resistance. Any more gains might send the price toward the $2.00 resistance. The next major hurdle for the bulls might be near $2.050.

More Losses?

If XRP fails to clear the $1.90 resistance zone, it could start a fresh decline. Initial support on the downside is near the $1.8420 level and the 61.8% Fib retracement level of the upward move from the $1.770 swing low to the $1.9578 high. The next major support is near the $1.80 level.

If there is a downside break and a close below the $1.80 level, the price might continue to decline toward $1.770. The next major support sits near the $1.750 zone, below which the price could continue lower toward $1.720.

Technical Indicators

Hourly MACD – The MACD for XRP/USD is now gaining pace in the bearish zone.

Hourly RSI (Relative Strength Index) – The RSI for XRP/USD is now below the 50 level.

Major Support Levels – $1.8420 and $1.80.

Major Resistance Levels – $1.880 and $1.920.

Market Opportunity
XRP Logo
XRP Price(XRP)
$1.3664
$1.3664$1.3664
+0.72%
USD
XRP (XRP) Live Price Chart
Disclaimer: The articles reposted on this site are sourced from public platforms and are provided for informational purposes only. They do not necessarily reflect the views of MEXC. All rights remain with the original authors. If you believe any content infringes on third-party rights, please contact crypto.news@mexc.com for removal. MEXC makes no guarantees regarding the accuracy, completeness, or timeliness of the content and is not responsible for any actions taken based on the information provided. The content does not constitute financial, legal, or other professional advice, nor should it be considered a recommendation or endorsement by MEXC.

You May Also Like

Wormhole breekt door $0,10 en stijgt meer dan 30%

Wormhole breekt door $0,10 en stijgt meer dan 30%

Wormhole (W) knalt vandaag door een belangrijk technisch niveau en laat een forse stijging zien. Na maanden van handel onder de grens van $0,10 is de coin er nu overtuigend doorheen gebroken. Met een koers van $0,116 en een handels volume van $404,49 miljoen in de afgelopen 24 uur, noteert... Het bericht Wormhole breekt door $0,10 en stijgt meer dan 30% verscheen het eerst op Blockchain Stories.
Share
Coinstats2025/09/18 20:33
3 Paradoxes of Altcoin Season in September

3 Paradoxes of Altcoin Season in September

The post 3 Paradoxes of Altcoin Season in September appeared on BitcoinEthereumNews.com. Analyses and data indicate that the crypto market is experiencing its most active altcoin season since early 2025, with many altcoins outperforming Bitcoin. However, behind this excitement lies a paradox. Most retail investors remain uneasy as their portfolios show little to no profit. This article outlines the main reasons behind this situation. Altcoin Market Cap Rises but Dominance Shrinks Sponsored TradingView data shows that the TOTAL3 market cap (excluding BTC and ETH) reached a new high of over $1.1 trillion in September. Yet the share of OTHERS (excluding the top 10) has declined since 2022, now standing at just 8%. OTHERS Dominance And TOTAL3 Capitalization. Source: TradingView. In past cycles, such as 2017 and 2021, TOTAL3 and OTHERS.D rose together. That trend reflected capital flowing not only into large-cap altcoins but also into mid-cap and low-cap ones. The current divergence shows that capital is concentrated in stablecoins and a handful of top-10 altcoins such as SOL, XRP, BNB, DOG, HYPE, and LINK. Smaller altcoins receive far less liquidity, making it hard for their prices to return to levels where investors previously bought. This creates a situation where only a few win while most face losses. Retail investors also tend to diversify across many coins instead of adding size to top altcoins. That explains why many portfolios remain stagnant despite a broader market rally. Sponsored “Position sizing is everything. Many people hold 25–30 tokens at once. A 100x on a token that makes up only 1% of your portfolio won’t meaningfully change your life. It’s better to make a few high-conviction bets than to overdiversify,” analyst The DeFi Investor said. Altcoin Index Surges but Investor Sentiment Remains Cautious The Altcoin Season Index from Blockchain Center now stands at 80 points. This indicates that over 80% of the top 50 altcoins outperformed…
Share
BitcoinEthereumNews2025/09/18 01:43
WLD Price Prediction: Worldcoin Eyes $0.42 Recovery Amid Technical Consolidation

WLD Price Prediction: Worldcoin Eyes $0.42 Recovery Amid Technical Consolidation

Worldcoin (WLD) trades at $0.39 with neutral RSI at 46, targeting $0.42 resistance. Technical indicators suggest consolidation before potential breakout. (Read
Share
BlockChain News2026/03/07 20:35