

Pudgy Penguins Price Prediction: PENGU Bulls Target $0.013 Breakout Amid Bullish Market Conditions

Highlights:
- The PENGU price has spiked by over 33% in the past week, currently trading at $0.012.
- PENGU’s mindshare surpasses 300 billion collective views, suggesting an increase in investor interest.
- The technical outlook shows PENGU bulls target $0.013 breakout amid rising bullish momentum.
The Pudgy Penguins (PENGU) price has hit $0.012, marking a 33% surge over the past week. The trading volume has notably soared 64% indicating heightened trading activity. The meme token remains a subject of interest in the market, as the collective mindshare of the success of the culture has already reached 300 billion views. Furthermore, favourable derivatives indicators show a positive future, implying even more profits to PENGU.
On Sunday, Pudgy Penguins noted on X that its mindshare has reached over 300 billion cumulative views on social media and trackers. This increase is a sign that there is an increased investor interest and the usage of meme-tokens. This is a positive sign of the future of PENGU, as the price could also continue to rally.
Notably, the Coinglass data shows that the futures open interest has soared, reaching $122.94 million, marking a 1.34% increase. The volume has notably skyrocketed to 57.53% to $728.29 million, indicating heightened market activity. The recent rise shows that new money is flowing into the PENGU market, which could fuel the Pudgy Penguins price rally.
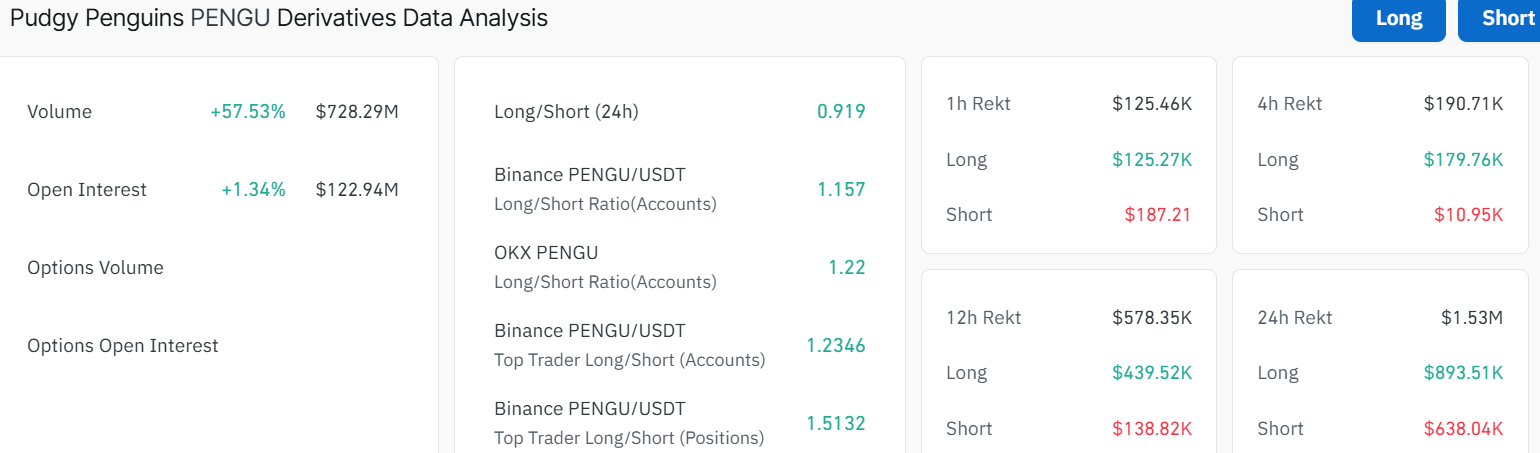 Pudgy Penguins Derivative CoinGlass
PENGU Bulls Target $0.013 Zone
Looking at the charts, Pudgy Penguin has rebounded from a critical support zone near $0.008. The price is now trading above the 50-day Simple Moving Average($0.0105), a major level watched by traders. A strong daily close above $0.013 would confirm the bullish breakout and open the doors for a rapid move to higher levels at $0.016.
Key resistance now sits at $0.013 and $0.022, where previous rallies paused. If buyers break through these barriers, upside targets at $0.027 and even $0.032 could come into play. The chart pattern signals that momentum could accelerate quickly if volume keeps increasing, especially as a rising 50-day moving average supports the new uptrend.
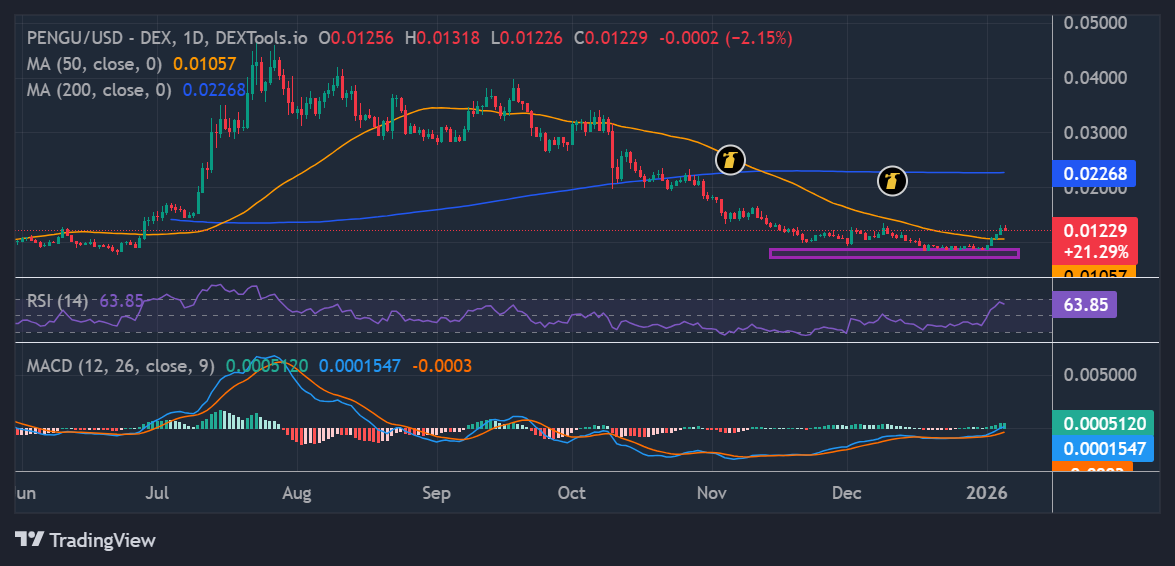 PENGU/USD 1-day chart: TradingView
A quick look at the momentum indicators, the Relative Strength Index (RSI) is sitting at 63.85. This suggests intense buying pressure in the PENGU market, but it has not yet hit the extreme overbought zone. In other words, there’s still room for more price growth before the coin becomes overbought.
Meanwhile, the MACD (Moving Average Convergence Divergence) is soaring towards the positive territory, hinting at a fresh bullish phase developing. If current trends hold, the Pudgy Penguin price could stage a rapid move toward $0.016 and $0.022 over the coming weeks. On the other hand, a well-known crypto analyst has predicted that if the PENGU price breaks the $0.013 level on the 12-hour chart, an explosive breakout towards $0.020 could be imminent.
However, traders should watch for short-term selling if the price fails to hold above $0.0105 support zone. A dip towards the $0.008 level could offer opportunities for patient buyers, but a decisive break above $0.016 would signal renewed momentum.
eToro Platform
Best Crypto Exchange
- Over 90 top cryptos to trade
- Regulated by top-tier entities
- User-friendly trading app
- 30+ million users
eToro is a multi-asset investment platform. The value of your investments may go up or down. Your capital is at risk. Don’t invest unless you’re prepared to lose all the money you invest. This is a high-risk investment, and you should not expect to be protected if something goes wrong.


You May Also Like

Strovum Is Building for the Moment When Crypto Finally Becomes Easy

Solana Dominates Crypto Token Launches, 85,000,000 Assets Registered


