

Stacks (STX) Price Prediction 2026, 2027-2030
- Bullish STX price prediction for 2026 is $0.3734 to $0.5214.
- Stacks (STX) price might reach $5 soon.
- Bearish (STX) price prediction for 2026 is $0.1626.
In this Stacks (STX) price prediction 2026, 2027-2030, we will analyze the price patterns of STX by using accurate trader-friendly technical analysis indicators and predict the future movement of the cryptocurrency.
|
TABLE OF CONTENTS
|
|
INTRODUCTION
|
|
|
STACKS (STX) PRICE PREDICTION 2026
|
|
| STACKS (STX) PRICE PREDICTION 2027, 2028-2030 |
| CONCLUSION |
| FAQ |
Stacks (STX) Current Market Status
| Current Price | $0.3536 |
| 24 – Hour Price Change | 7.69% Up |
| 24 – Hour Trading Volume | $66.75M |
| Market Cap | $641.07M |
| Circulating Supply | 1.81B STX |
| All – Time High | $3.84 (On April 01, 2024) |
| All – Time Low | $0.04501 (On Mar 13, 2020) |
What is Stacks (STX)
| TICKER | STX |
| BLOCKCHAIN | Stacks |
| CATEGORY | Layer 2 Blockchain |
| LAUNCHED ON | June 2019 |
| UTILITIES | Governance, security, gas fees & rewards |
Stacks is a layer-1 blockchain solution designed to bring smart contracts and decentralized applications (DApps) to Bitcoin (BTC). It achieves this without altering the core features that make Bitcoin so powerful, such as its security and stability. Powered by the Stacks token (STX), this platform fuels smart contract execution, transaction processing, and the registration of new digital assets on the Stacks 2.0 blockchain. Essentially, Stacks enhances Bitcoin’s capabilities without forking or changing the original blockchain.
Recently, Stacks has kicked off its Nakamoto upgrade to make transactions even faster. Named after Bitcoin’s mysterious creator, Satoshi Nakamoto, this upgrade will separate the block production schedule of Stacks from that of Bitcoin. Network operators now have a two-week window to implement the upgrade, after which a hard fork will finalize the changes. The Nakamoto upgrade introduces a new method for producing Stacks blocks using a proof-of-transfer consensus algorithm. Users will burn Bitcoin (BTC) to mine Stacks blocks and earn rewards. This process began in April, with block “signers” coming online to validate transaction “tenures.”
Stacks 24H Technicals
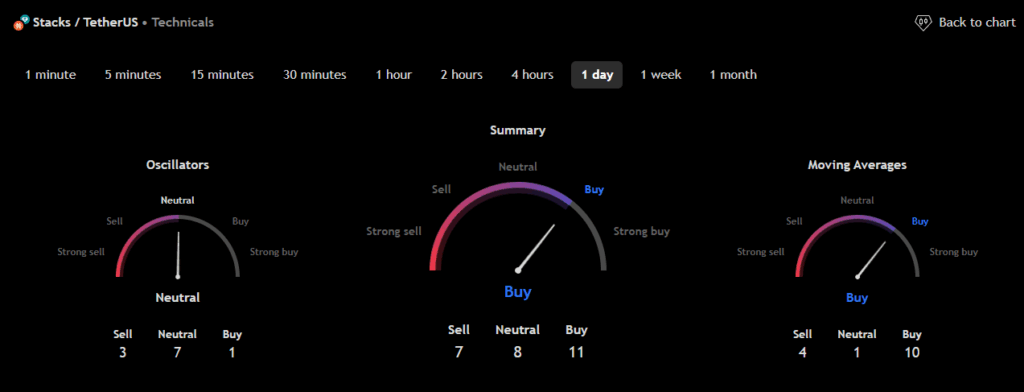 (Source: TradingView)
Stacks (STX) Price Prediction 2026
Stacks (STX) ranks 81st on CoinMarketCap in terms of its market capitalization. The overview of the Stacks price prediction for 2026 is explained below with a daily time frame.
In the above chart, Stacks (STX) laid out a descending channel pattern. Descending channel patterns are short-term bearish in that a stock moves lower within a descending channel, but they often form longer-term uptrends as continuation patterns. Higher prices often follow the descending channel pattern. But only after an upside penetration of the upper trend line. A descending channel is drawn by connecting the lower highs and lower lows of a security’s price with parallel trendlines to show a downward trend.
A trader could make a selling bet within a descending channel when the security price reaches its resistance trendline. An ascending channel is the opposite of a descending channel. Both ascending and descending channels are primary channels followed by technical analysts.
At the time of analysis, the price of Stacks (STX) was recorded at $0.3536. If the pattern trend continues, then the price of STX might reach the resistance levels of $0.3738 and $0.6734. If the trend reverses, then the price of STX may fall to the support of $0.2993 and $0.2353.
Stacks (STX) Resistance and Support Levels
The chart given below elucidates the possible resistance and support levels of Stacks (STX) in 2026.
From the above chart, we can analyze and identify the following as resistance and support levels of Stacks (STX) for 2026.
| Resistance Level 1 | $0.3734 |
| Resistance Level 2 | $0.5214 |
| Support Level 1 | $0.2372 |
| Support Level 2 | $0.1626 |
STX Resistance & Support Levels
Stacks (STX) Price Prediction 2026 — RVOL, MA, and RSI
The technical analysis indicators such as Relative Volume (RVOL), Moving Average (MA), and Relative Strength Index (RSI) of Stacks (STX) are shown in the chart below.
From the readings on the chart above, we can make the following inferences regarding the current Stacks (STX) market in 2026.
| INDICATOR | PURPOSE | READING | INFERENCE |
| 50-Day Moving Average (50MA) | Nature of the current trend by comparing the average price over 50 days | 50 MA = $0.2885Price = $0.3502 (50MA < Price) |
Bullish/Uptrend |
| Relative Strength Index (RSI) | Magnitude of price change;Analyzing oversold & overbought conditions | 69.4017 <30 = Oversold 50-70 = Neutral>70 = Overbought |
Neutral |
| Relative Volume (RVOL) | Asset’s trading volume in relation to its recent average volumes | Below cutoff line | Weak Volume |
Stacks (STX) Price Prediction 2026 — ADX, RVI
In the below chart, we analyze the strength and volatility of Stacks (STX) using the following technical analysis indicators — Average Directional Index (ADX) and Relative Volatility Index (RVI).
From the readings on the chart above, we can make the following inferences regarding the price momentum of Stacks (STX).
| INDICATOR | PURPOSE | READING | INFERENCE |
| Average Directional Index (ADX) | Strength of the trend momentum | 41.6185 | Weak Trend |
| Relative Volatility Index (RVI) | Volatility over a specific period | 49.33 <50 = Low >50 = High |
Low Volatility |
Comparison of STX with BTC, ETH
Let us now compare the price movements of Stacks (STX) with those of Bitcoin (BTC) and Ethereum (ETH).
From the above chart, we can interpret that the price action of STX is similar to that of BTC and ETH. That is, when the price of BTC and ETH increases or decreases, the price of STX also increases or decreases, respectively.
Stacks (STX) Price Prediction 2027, 2028 – 2030
With the help of the aforementioned technical analysis indicators and trend patterns, let us predict the price of Stacks (STX) between 2027, 2028, 2029, and 2030.
| Year | Bullish Price | Bearish Price |
| Stacks (STX) Price Prediction 2027 | $7 | $0.1 |
| Stacks (STX) Price Prediction 2028 | $9 | $0.09 |
| Stacks (STX) Price Prediction 2029 | $11 | $0.08 |
| Stacks (STX) Price Prediction 2030 | $13 | $0.07 |
Conclusion
If Stacks (STX) establishes itself as a good investment in 2026, this year would be favorable to the cryptocurrency. In conclusion, the bullish Stacks (STX) price prediction for 2026 is $0.5214. Comparatively, if unfavorable sentiment is triggered, the bearish Stacks (STX) price prediction for 2026 is $0.1626.
If the market momentum and investors’ sentiment positively elevate, then Stacks (STX) might hit $5. Furthermore, with future upgrades and advancements in the Stacks ecosystem, STX might surpass its current all-time high (ATH) of $3.84 and mark a new ATH.
FAQ
1. What is Stacks (STX)?
Stacks is a layer-1 blockchain solution that is designed to bring smart contracts and decentralized applications (DApps) to Bitcoin (BTC).
2. Where can you buy Stacks (STX)?
Traders can trade Stacks (STX) on cryptocurrency exchanges such as Binance, Bybit, OKX, Bitget, and CoinTR Pro.
3. Will Stacks (STX) record a new ATH soon?
With the ongoing developments and upgrades within the Stacks platform, Stacks (STX) has a high possibility of reaching its ATH soon.
4. What is the current all-time high (ATH) of Stacks (STX)?
Stacks (STX) hit its current all-time high (ATH) of $3.84 on April 01, 2024.
5. What is the lowest price of Stacks (STX)?
According to CoinMarketCap, STX hit its all-time low (ATL) of $0.04501 On March 13, 2020.
6. Will Stacks (STX) hit $5?
If Stacks (STX) becomes one of the active cryptocurrencies that majorly maintain a bullish trend, it might rally to hit $5 soon.7
7. What will be the Stacks (STX) price by 2027?
Stacks (STX) price might reach $7 by 2027.
8. What will be the Stacks (STX) price by 2028?
Stacks (STX) price might reach $9 by 2028.
9. What will be the Stacks (STX) price by 2029?
Stacks (STX) price might reach $11 by 2029.
10. What will be the Stacks (STX) price by 2030?
Stacks (STX) price might reach $13 by 2030.
Top Crypto Predictions
Injective (INJ) Price Prediction
Sui (SUI) Price Prediction
Aptos (APT) Price Prediction
Disclaimer: The opinion expressed in this chart is solely the author’s. It does not represent any investment advice. TheNewsCrypto team encourages all to do their own research before investing.


You May Also Like

Data focus shifts to payrolls – Societe Generale

Not a loophole: Singapore AI export controls let China tap US AI legally

Q2 Market Insights: Bitcoin regains dominance in risk-averse environment, ETFs remain critical to market structure


