The post XRP Price Reclaims $2 As Bulls Return—Is A 10% Bounce Possible This Week? appeared first on Coinpedia Fintech News XRP price opened the year with a sharpThe post XRP Price Reclaims $2 As Bulls Return—Is A 10% Bounce Possible This Week? appeared first on Coinpedia Fintech News XRP price opened the year with a sharp

XRP Price Reclaims $2 As Bulls Return—Is A 10% Bounce Possible This Week?

2026/01/20 02:17
3 min read
For feedback or concerns regarding this content, please contact us at crypto.news@mexc.com
Why XRP Is Going up Today?

The post XRP Price Reclaims $2 As Bulls Return—Is A 10% Bounce Possible This Week? appeared first on Coinpedia Fintech News

XRP price opened the year with a sharp rally of over 20%, outpacing larger majors like Bitcoin and Ethereum. However, the momentum didn’t stay one-way for long. As Bitcoin dipped, the XRP price plunged from above $2 to near $1.80 within hours before buyers stepped in. Even after the bounce, XRP remains stuck in a tug-of-war between dip buyers and overhead sellers. This is keeping the near-term outlook uncertain and highly sensitive to the next market-wide move.

XRP Liquidation Heatmap Shows Where Volatility Could Spike Next

The 48-hour heatmap from Coinglass shows a thick liquidation band sitting just above the price at around $2.1. XRP is trading near $2.00–$2.02, so a push into $2.06–$2.10 is the first “squeeze zone” where shorts can get forced out, and price can accelerate.

xrp price

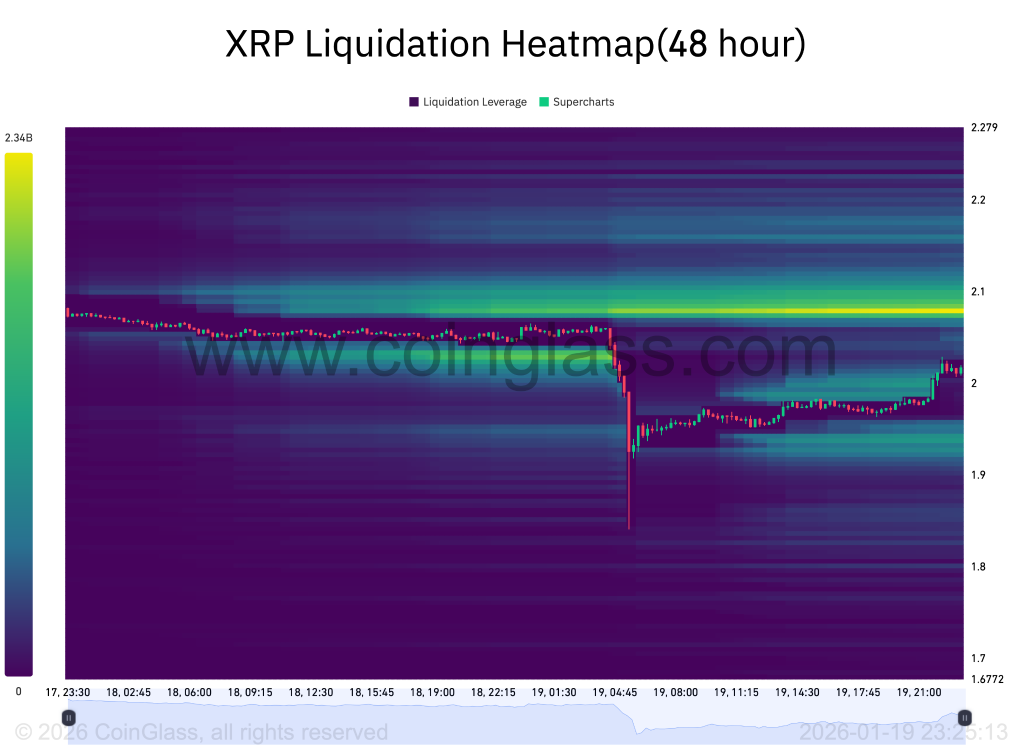
The earlier liquidation sweep drove XRP close to $1.70–$1.75, suggesting a chunk of downside leverage has been flushed. Still, if $2 fails again, the next meaningful liquidity pocket sits around $1.90, followed by a deeper magnet zone near $1.80. Above $2.10: higher odds of a fast wick/extension, and below $1.90: opens a path toward $1.80 as stops and late longs get hit.

XRP Open Interest: Leverage Reset, But It’s Rebuilding

XRP open interest remains well below the earlier peak, but the latest data shows a small dip in recent sessions. This suggests traders are trimming leverage rather than adding aggressively. This pullback likely reflects post-volatility deleveraging after the sharp intraday drop, where late longs were forced out or chose to cut risk. 

xrp price

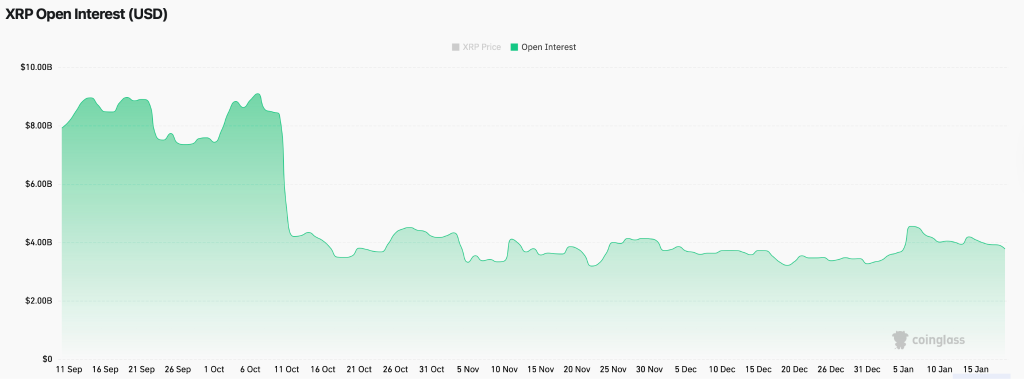
It may also be driven by profit-taking after XRP reclaimed the $2 handle, as short-term traders closed positions instead of pressing for continuation. Macro uncertainty and Bitcoin-led swings can further reduce appetite for holding high leverage through choppy conditions.

The impact is two-sided. On the positive side, lower open interest reduces “crowding,” which can limit liquidation cascades and help XRP stabilize. On the flip side, cooler leverage can make upside moves less explosive, shifting rallies into a slower grind unless spot demand steps in.

What’s Next for the XRP Price? 

XRP’s derivatives setup points to controlled volatility, not a one-way breakout. The slight dip in open interest reduces crowding, which can help the price base above the $2 handle. It also means the upside may be grindier unless fresh leverage or spot bids return. From the liquidation map, the first upside magnet sits around $2.06–$2.10—a clean push through that zone can trigger a squeeze toward $2.15–$2.20. 

However, repeated rejection near $2 with leverage rebuilding would raise breakdown risk. If XRP slips below $1.90, liquidation pockets could pull the price toward $1.80, with a deeper sweep possible into the mid-$1.70s if selling accelerates.

Market Opportunity
XRP Logo
XRP Price(XRP)
$1.3174
$1.3174$1.3174
+1.30%
USD
XRP (XRP) Live Price Chart
Disclaimer: The articles reposted on this site are sourced from public platforms and are provided for informational purposes only. They do not necessarily reflect the views of MEXC. All rights remain with the original authors. If you believe any content infringes on third-party rights, please contact crypto.news@mexc.com for removal. MEXC makes no guarantees regarding the accuracy, completeness, or timeliness of the content and is not responsible for any actions taken based on the information provided. The content does not constitute financial, legal, or other professional advice, nor should it be considered a recommendation or endorsement by MEXC.

You May Also Like

Today’s Biggest Crypto Movers: Dogecoin Leads the Pack

Today’s Biggest Crypto Movers: Dogecoin Leads the Pack

Today's Biggest Crypto Movers: Dogecoin Leads the Pack 🚀 Crypto Markets Heat Up Today Major cryptocurrencies are showing strong gains. Let's dive into today's top
Share
Blockchainmagazine2026/04/03 13:00
RWA Boom Accelerates As Tokenized Assets Hit New Highs In Early 2026

RWA Boom Accelerates As Tokenized Assets Hit New Highs In Early 2026

RWA distributed value rose from about $21B to $27.5B in Q1 2026, a gain of roughly 30%. Tokenized US Treasuries reached about $10B, creating an on-chain yield base
Share
LiveBitcoinNews2026/04/03 13:00
Cryptos Signal Divergence Ahead of Fed Rate Decision

Cryptos Signal Divergence Ahead of Fed Rate Decision

The post Cryptos Signal Divergence Ahead of Fed Rate Decision appeared on BitcoinEthereumNews.com. Crypto assets send conflicting signals ahead of the Federal Reserve’s September rate decision. On-chain data reveals a clear decrease in Bitcoin and Ethereum flowing into centralized exchanges, but a sharp increase in altcoin inflows. The findings come from a Tuesday report by CryptoQuant, an on-chain data platform. The firm’s data shows a stark divergence in coin volume, which has been observed in movements onto centralized exchanges over the past few weeks. Bitcoin and Ethereum Inflows Drop to Multi-Month Lows Sponsored Sponsored Bitcoin has seen a dramatic drop in exchange inflows, with the 7-day moving average plummeting to 25,000 BTC, its lowest level in over a year. The average deposit per transaction has fallen to 0.57 BTC as of September. This suggests that smaller retail investors, rather than large-scale whales, are responsible for the recent cash-outs. Ethereum is showing a similar trend, with its daily exchange inflows decreasing to a two-month low. CryptoQuant reported that the 7-day moving average for ETH deposits on exchanges is around 783,000 ETH, the lowest in two months. Other Altcoins See Renewed Selling Pressure In contrast, other altcoin deposit activity on exchanges has surged. The number of altcoin deposit transactions on centralized exchanges was quite steady in May and June of this year, maintaining a 7-day moving average of about 20,000 to 30,000. Recently, however, that figure has jumped to 55,000 transactions. Altcoins: Exchange Inflow Transaction Count. Source: CryptoQuant CryptoQuant projects that altcoins, given their increased inflow activity, could face relatively higher selling pressure compared to BTC and ETH. Meanwhile, the balance of stablecoins on exchanges—a key indicator of potential buying pressure—has increased significantly. The report notes that the exchange USDT balance, around $273 million in April, grew to $379 million by August 31, marking a new yearly high. CryptoQuant interprets this surge as a reflection of…
Share
BitcoinEthereumNews2025/09/18 01:01

Trade GOLD, Share 1,000,000 USDT

Trade GOLD, Share 1,000,000 USDTTrade GOLD, Share 1,000,000 USDT

0 fees, up to 1,000x leverage, deep liquidity