

Ethereum price breaks down from consolidation near $2,800 as spot ETH ETFs shed $155M
Ethereum price slid out of its recent consolidation range near $2,800 on as renewed exchange-trade fund outflows and weak trader positioning weighed on short-term sentiment.
- Ethereum broke below a key consolidation zone as ETF outflows returned.
- Derivatives data pointed to traders cutting risk rather than adding leverage.
- Technical signals show growing downside pressure below key resistance.
Ethereum was trading at $2,739 at press time, down 8% over the past 24 hours. The second-largest cryptocurrency is now down 8% over the past week and nearly 10% over the past month, even as 24-hour trading volume jumped 81% to $42.8 billion, pointing to rising activity during the sell-off.
Derivatives show traders cutting risk rather than adding leverage. According to CoinGlass data, Ethereum (ETH) futures volume climbed 55% to $90.55 billion, while open interest fell 11% to $34.29 billion.
This combination reflects heavy position turnover and long liquidations, with traders closing or being forced out of existing bets instead of building fresh exposure.
ETF outflows weigh on near-term demand
U.S. spot ETH ETFs returned to net outflows on Jan. 29, with $155 million leaving the products in a single session, as per SoSoValue data. Fidelity’s FETH saw $59.19 million in redemptions, while BlackRock’s ETHA lost $54.88 million. Weekly outflows now stand at $74 million.
ETF flows now play a major role in shaping Ethereum’s short-term price action because they reflect how large, traditional investors are positioning. Steady spot demand is reduced when money leaves these funds, and issuers may have to sell ETH to cover redemptions, further pressuring already fragile sessions.
In addition to ETF outflows, a recent decline in the Coinbase Premium Index also points to limited interest from U.S. traders, which has caused ETH to drift in narrow ranges.
Market sentiment has been further strained by network-related headlines. While talks about quantum-resistant upgrades have brought attention to longer-term security issues, reports of a potential large-scale poisoning attack have sparked new concerns about user safety.
None of these issues poses an immediate threat to Ethereum’s operations, but together they have reinforced a cautious mood at a time when trader confidence is already weak.
Ethereum price technical analysis
Ethereum’s move below the $2,800–$2,900 area confirms that the recent consolidation has broken down. This zone had contained price for weeks, and losing it shows that sellers have taken back control.
The short-term structure is still pointing lower. ETH continues to form lower highs, and recent rebound attempts faded near the $3,050–$3,100 region, where selling pressure remains heavy.
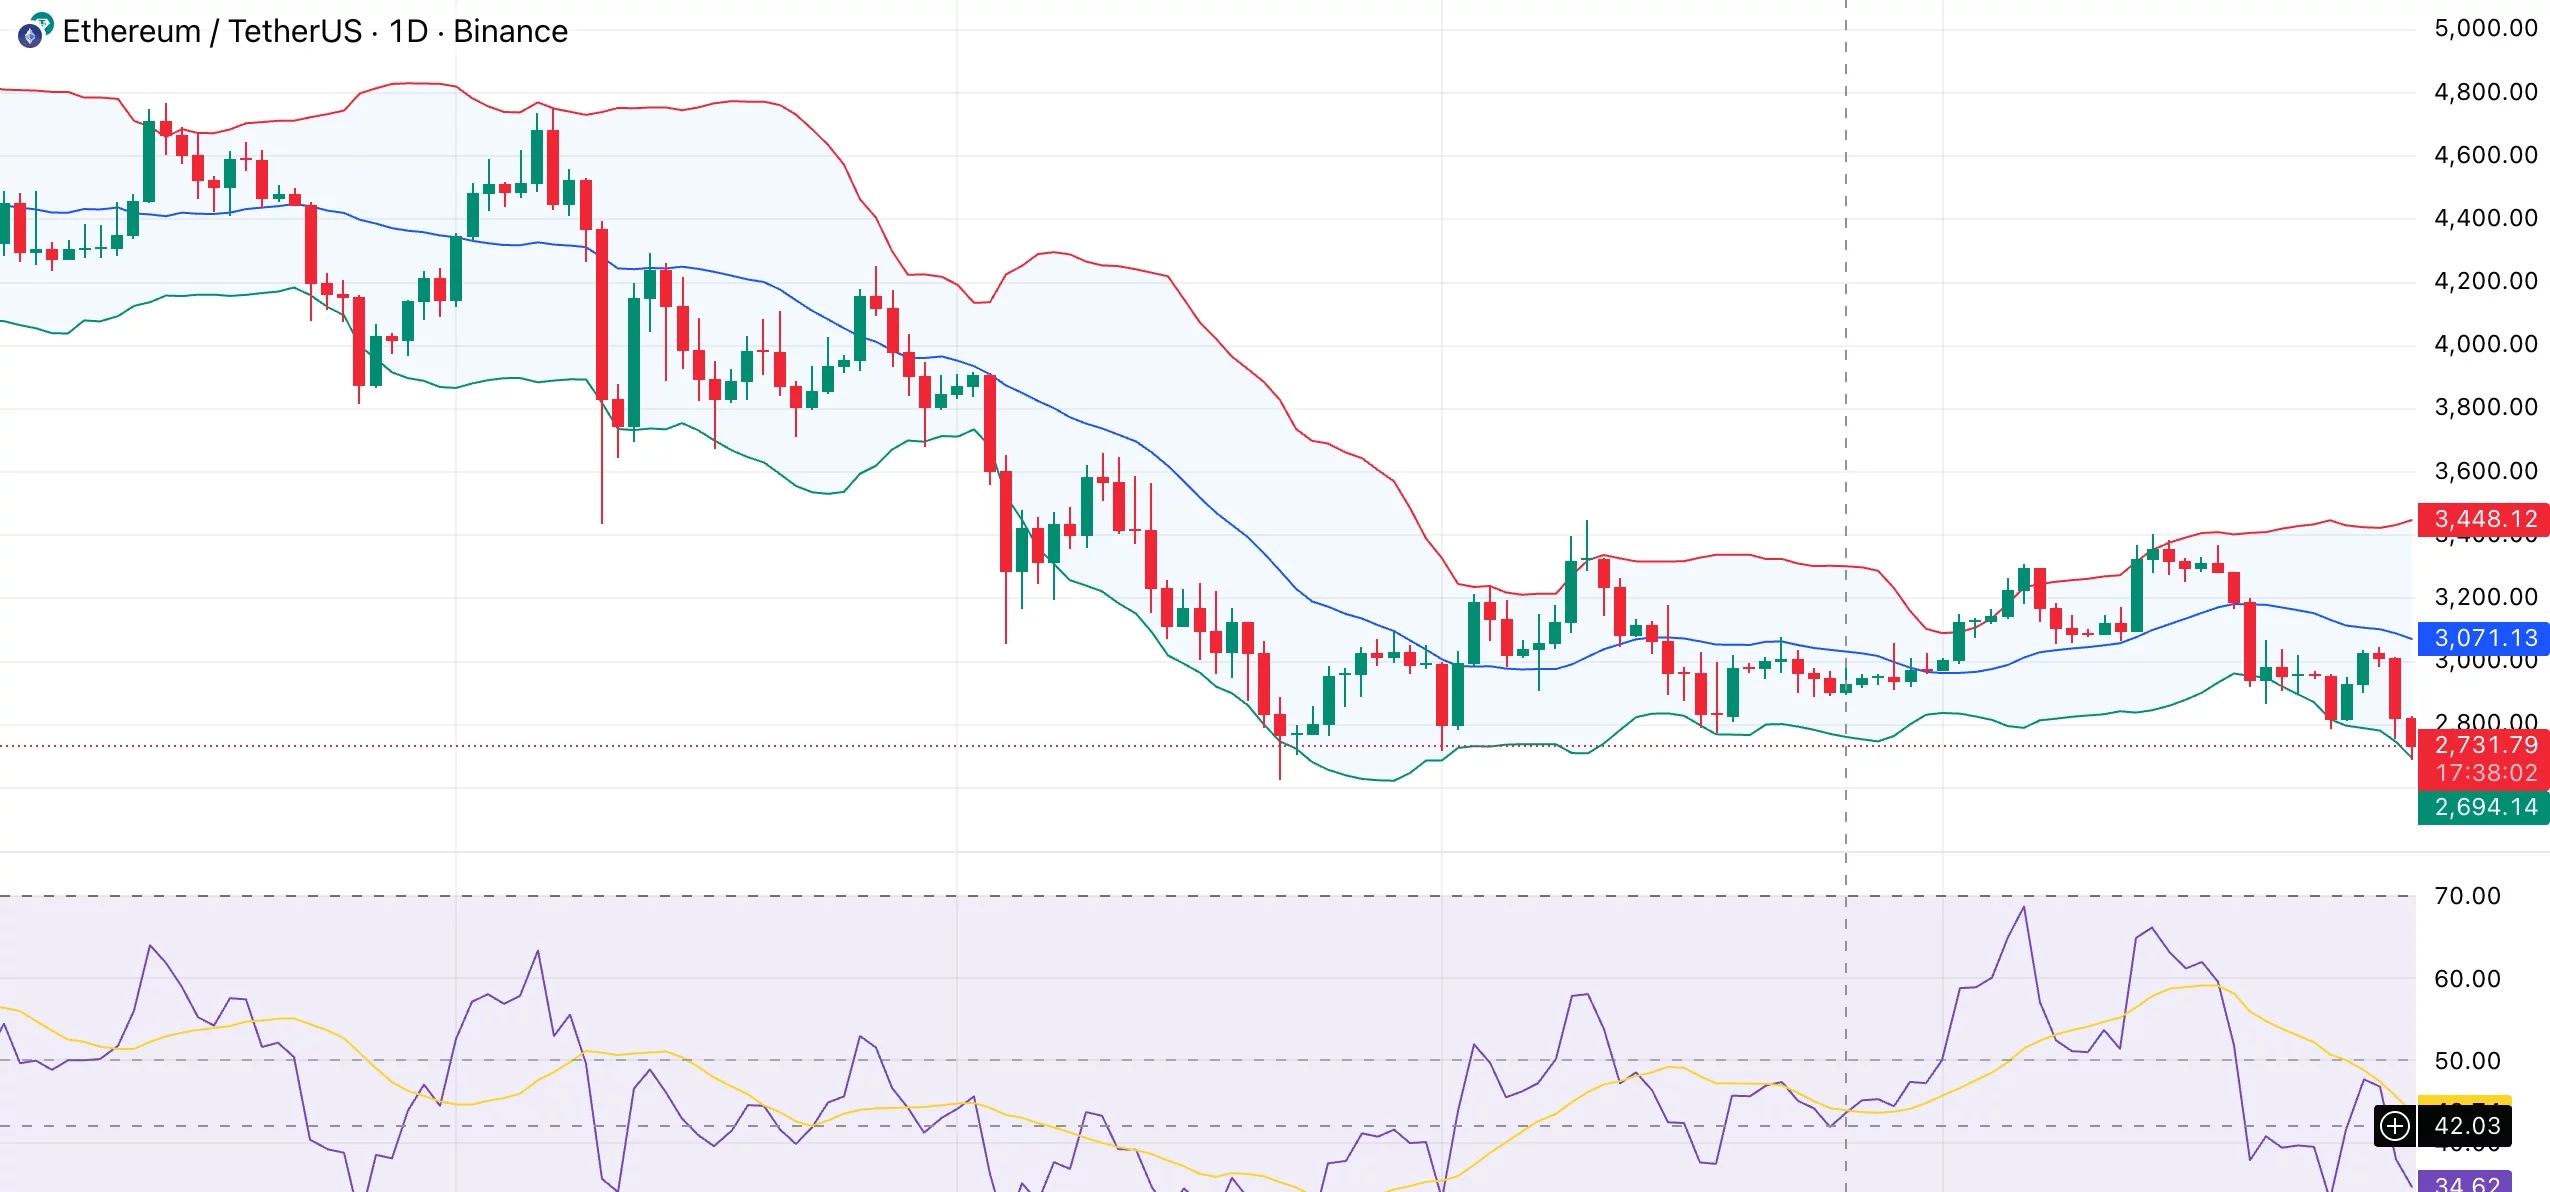
Price is now sitting below its short-term moving averages, with the middle Bollinger band near $3,070 acting as a ceiling. As long as ETH stays under this level, rallies are likely to run into resistance.
After a long period of tight trading, volatility is picking up. The Bollinger Bands have started to open to the downside, confirming the recent break from range. The relative strength index is now in the low 40s, indicating a weakening of momentum.
This suggests that there is bearish pressure but not yet severe selling, allowing for more drops before buyers intervene. The $2,700 area, which corresponds with the lower Bollinger Band and recent lows, is the first notable support on the downside.
For the outlook to improve, ETH would need to climb back above $2,950–$3,000 and hold that area on a daily close. A move through this zone would invalidate the breakdown and bring $3,100 back into focus.
Until that happens, the trend favors the downside, with most rebounds likely to be short-lived rather than begin a new uptrend.


You May Also Like

Binance Commits $500K to Scale National Ukraine Web3 Ecosystem Growth – Exchanges Bitcoin News

Crypto News: Tether Launches $200M Crypto Fund to Expand XAUT Holdings


