

Ethereum Could Crash to $2,100 Again—Here’s Why

Ethereum faced renewed selling pressure after breaching a key floor near $2,800, signaling that the downtrend could extend if bears stay in control. Over the past three sessions, the ETH/USD pair slid more than 10%, dipping below the pivotal level that had acted as a support zone through late 2025. In this environment, chart patterns align with a continuing weaker bias: descending and symmetrical triangle configurations appear to converge toward a much lower target, with technicals and on-chain metrics reinforcing a cautious stance for traders. The most immediate concern is whether buyers can defend the next major support around $2,500, which also coincides with the 200‑week simple moving average, potentially offering a longer-term anchor if held.
Ether (CRYPTO: ETH) has traded around the mid-$2,700s as of writing, a level that market observers describe as a “do or die” juncture for bulls. If the $2,800 barrier fails decisively, the road toward lower levels could become more probable, according to traders tracking the pattern formations and momentum signals. A widely cited technician noted that a failure to hold the current area would reinforce the bearish dominance and open the door to the mid-$2,500s, a zone that would perhaps test the integrity of a broader structural shift. The breach also ties into a broader narrative that dominated recent weeks, where the market wrestled with whether the range between $3,000 and $2,800 would prove durable or prove to be a staging ground for further losses.
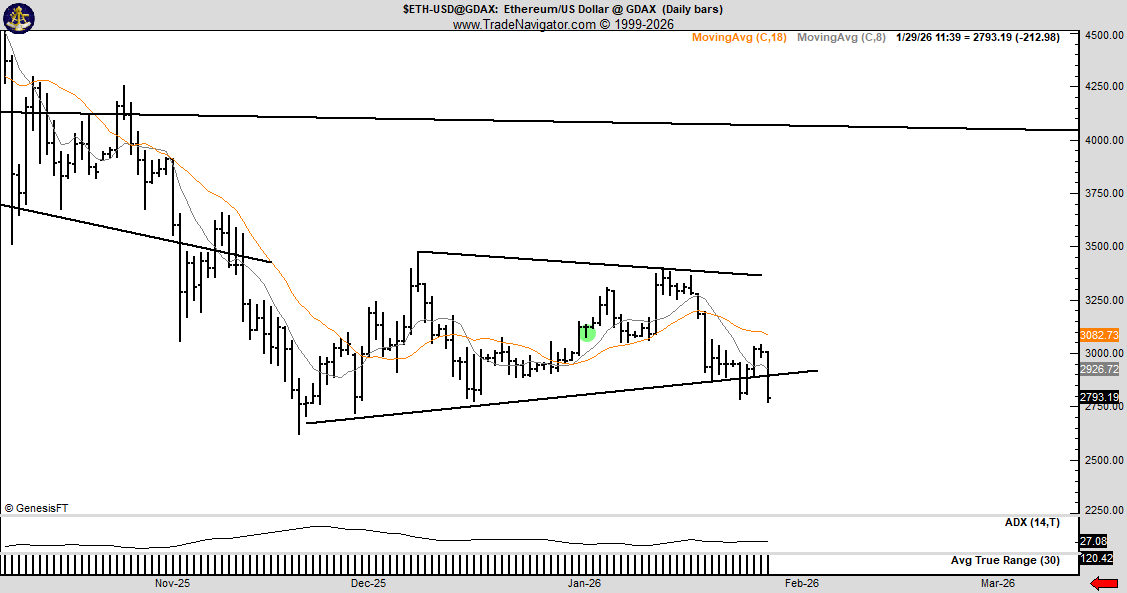
The chart geometry surrounding ETH/USD features a breached horizontal line within a descending triangle, an arrangement that traders often monitor for continuation signals. The next major milestone on the downside is around $2,500, aligning with the 200-week moving average, which can provide longer‑term support if price action finds footing there. Beyond that lie the triangle’s measured target near $2,150, a level that implies roughly a 20% decline from current prices if momentum remains tilting to the bears. A drop to that area would be consistent with prior bear cycles where similar patterns preceded sharper downturns.
ETH/USD daily chart. Source: Cointelegraph/TradingViewA notable momentum signal also points to caution: the relative strength index has slipped from the mid-60s in early January to the mid-30s, suggesting waning upside momentum even as prices press lower. Such a softening RSI, paired with a price break below critical support, often accompanies extended corrective moves, particularly in asset classes where speculative risk remains elevated. Veteran traders have weighed in on the breakdowns, with one noted analyst arguing that the price action post-break below the triangle’s lower boundary increases the probability of further downside, given the combination of price and momentum dynamics.
The price trajectory has historically aligned with a broader framework where pattern-based downside targets precede meaningful pullbacks. In this instance, the calculated target anchored by the triangle suggests a potential landing zone near $2,100, roughly a 22% retreat from levels seen just before the breach. The area between $3,000 and $2,800 has been identified as a critical support corridor in prior analyses, and losing it has raised the stakes for ETH bulls.
 ETH/USD daily chart. Source: Peter Brandt
On-chain data adds another layer to the bear case. Ether’s net unrealized profit/loss indicator has shifted from a mood of “anxiety” toward the “fear zone,” a regime that often accompanies extended drawdowns and capitulation phases in previous cycles. The NUPL metric reflects the balance between realized profits and losses among holders, and its move into fear aligns with a risk-off posture among market participants. As the market tests lower zones, such on-chain signals may precede stronger downside pressure, especially if selling accelerates and new liquidity cycles fail to materialize any sustained relief rallies.
In a separate technical track, the relationship between the 111-day and 200-day moving averages has drawn attention. Current patterns show the shorter-term average slipping below the longer-term one, a cross that has historically preceded larger drawdowns during prior bear markets in 2018 and 2022. This cross‑over framework reinforces the view that downside risk remains elevated unless a durable buying interest emerges to reverse momentum.
Ethereum bears out the pattern, but on-chain context matters
The convergence of chart structures with on-chain indicators paints a coherent, if cautious, portrait of Ethereum’s near-term risk landscape. While the immediate level of $2,800 has given way, observers note that the critical question is whether demand can re-emerge at the $2,500 zone or whether the price will slide toward the triangle’s lower target. The intersection of technical patterns and on-chain data—particularly the NUPL shift into fear—suggests traders should prepare for continued volatility, with a possible window for a relief rally only if liquidity conditions improve and selling pressure subsides.
Overall, the current setup mirrors episodes in past cycles where market structure and on-chain sentiment aligned to produce pronounced selling pressure before a more durable bottom formed. The charts indicate that even if a rebound materializes above the next falling support, the path of least resistance may remain to the downside in the near term, unless a confluence of catalysts shifts sentiment, liquidity, and risk appetite back toward equities and risk assets.
ETH has demonstrated a capacity for rapid retracements in prior cycles, but the overlay of a fear-driven on-chain lens raises the bar for any immediate revival. Traders will be watching how price action responds around the 200-week SMA and whether the triangle’s measured target continues to hold as a compass for subsequent moves. The next weeks could reveal whether bulls can salvage the breach or whether further losses consolidate into a fresh lower-high, lower-low configuration that would sustain a risk-off regime for ETH and potentially ripple across broader crypto markets.
This article was originally published as Ethereum Could Crash to $2,100 Again—Here’s Why on Crypto Breaking News – your trusted source for crypto news, Bitcoin news, and blockchain updates.


You May Also Like

Lexston Mining Engages Dentons Delany to Explore Mineral Opportunities in Guyana

BitGo Launches Stablecoin Minting and Redemption Service for Institutions

Crypto Banking Software Development: Building the Future of Digital Finance in 2026


Trending News
More24/7 Live News
More
