Cardano price sits at a critical point as February unfolds. A long-standing ascending trendline that guided ADA price action since 2020 finally gave way in lateCardano price sits at a critical point as February unfolds. A long-standing ascending trendline that guided ADA price action since 2020 finally gave way in late

Cardano Price Prediction for February: ADA Faces Danger After Breaking 6-Year Support

2026/02/04 17:45
3 min read
For feedback or concerns regarding this content, please contact us at crypto.news@mexc.com

Cardano price sits at a critical point as February unfolds. A long-standing ascending trendline that guided ADA price action since 2020 finally gave way in late January. That single move changed the entire structure. What once looked like a reliable dip-buying zone now feels uncertain.

From a wider view, Cardano price had respected that rising trendline through multiple market cycles. Each dip toward it attracted buyers and sparked recoveries. That history shaped expectations. Late January disrupted that pattern in a meaningful way.

That event carried weight because the level had acted as a consistent demand zone for nearly 6 years. Once price slipped beneath it, selling pressure accelerated.

ADA Price Chart

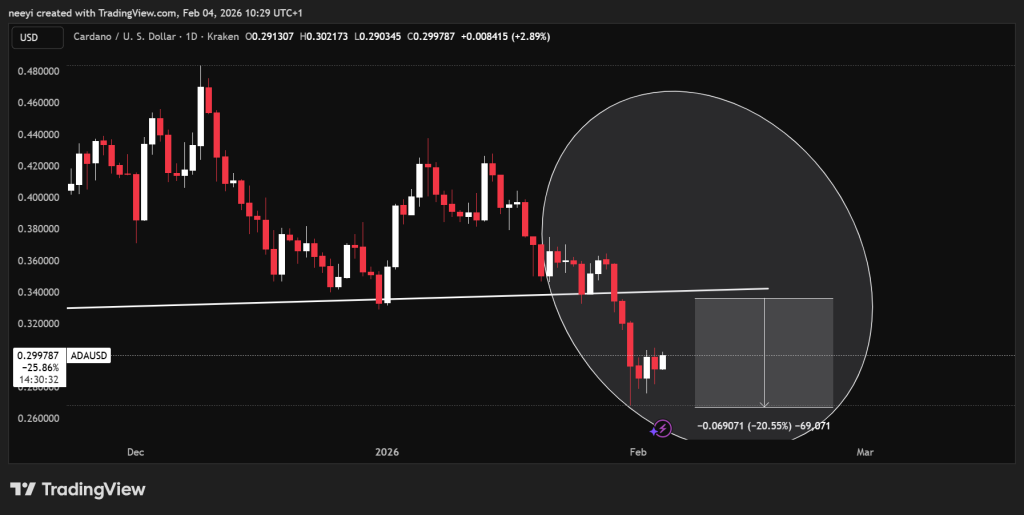
The decline that followed was sharp. Cardano price fell close to 20%. The move dragged ADA from around $0.33 down to $0.23. Some recovery followed, price now trades closer to $0.3 as ADA price enters a retest phase.

This phase often decides direction. A successful reclaim could repair some of the damage. Failure would confirm the break as genuine.

ADA Price Prediction for February

ADA Price Retest Phase Puts Focus On Trendline Resistance

Cardano price now moves back toward the broken trendline. Buyers hope this level flips back into support. From the current zone near $0.3, that reclaim would require a push of roughly 15%.

If ADA price climbs above the trendline in February, upside targets open up. Cardano could trade between $0.35 and $0.4 in a strong recovery scenario. That outcome depends on follow-through and broader market stability.

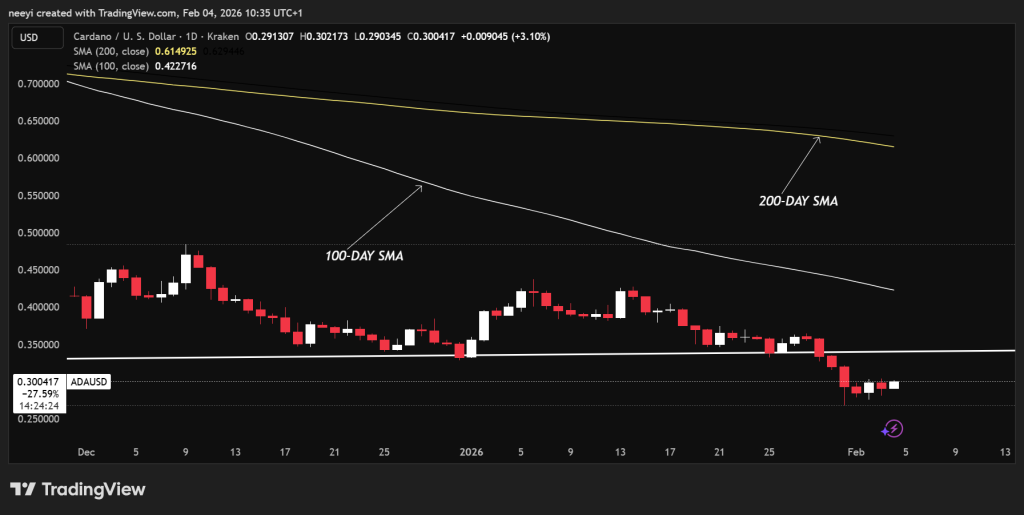
The 100-day and 200-day simple moving averages sit well above current Cardano price. Both levels act as overhead resistance. Distance from these averages leaves room for a wider rebound if conditions improve.

ADA Price Chart

Such a move depends on one factor. ADA price must clear the trendline first. A clean break above that level could allow Cardano price to work toward the moving averages. That scenario aligns with a push toward the $0.35 to $0.4 zone.

This bullish pattern exists but confidence remains limited after such a historic support break.

Cardano Price Prediction Leans Toward Range-Bound Pressure

A more cautious Cardano price prediction centers on resistance holding firm. If the former trendline acts as a ceiling, price could struggle near $0.33. This could trigger a prolonged consolidation between $0.33 and the current low of $0.26 in the near term.

Read Also: XRP Price Prediction for February: The Worst May Still Be Ahead

Continued weakness in Bitcoin price would add pressure. ADA price often tracks broader market stress. Without external relief, consolidation between resistance and support appears likely.

Subscribe to our YouTube channel for daily crypto updates, market insights, and expert analysis.

The post Cardano Price Prediction for February: ADA Faces Danger After Breaking 6-Year Support appeared first on CaptainAltcoin.

Disclaimer: The articles reposted on this site are sourced from public platforms and are provided for informational purposes only. They do not necessarily reflect the views of MEXC. All rights remain with the original authors. If you believe any content infringes on third-party rights, please contact crypto.news@mexc.com for removal. MEXC makes no guarantees regarding the accuracy, completeness, or timeliness of the content and is not responsible for any actions taken based on the information provided. The content does not constitute financial, legal, or other professional advice, nor should it be considered a recommendation or endorsement by MEXC.

You May Also Like

Top White House official warns aides against selling Trump 'rose-colored view' of Iran war

Top White House official warns aides against selling Trump 'rose-colored view' of Iran war

After returning to the White House on January 20, 2025, President Donald Trump made sure his second administration was much different from his first. Trump clashed
Share
Alternet2026/04/03 01:59
Vacation plans implode across America as Trump massacres the economy

Vacation plans implode across America as Trump massacres the economy

More and more Americans are finding that not even a nice vacation can save them from President Donald Trump's chaos.According to a Thursday report from Bloomberg
Share
Alternet2026/04/03 02:22
$5 billion floods into XRP in a day; Here’s why

$5 billion floods into XRP in a day; Here’s why

The post $5 billion floods into XRP in a day; Here’s why appeared on BitcoinEthereumNews.com. XRP extended its rally on September 18, adding more than $5 billion in market value in under 24 hours. The token climbed from $3 to $3.10, pushing its market cap from $180.47 billion to $185.79 billion at the time of publication. Trading activity also surged, with 24-hour volume up 57% to $7.21 billion, as per data retrieved by Finbold from CoinMarketCap. The move coincides with confirmation that the REX-Osprey XRP ETF ($XRPR) will debut today after earlier delays. Unlike traditional spot ETFs, $XRPR will operate under a Registered Investment Company (RIC) structure, holding XRP alongside cash and Treasuries. Analysts say the product offers three key signals: it provides regulated exposure for U.S. investors without requiring direct XRP custody, it highlights growing institutional acceptance despite SEC hesitation on other ETF applications, and it is already sparking ETF-driven trading activity in spot markets. Sustaining daily volumes of over $200 million will be a key test in the weeks ahead. XRP technical analysis From a technical perspective, XRP has broken above its 7-day SMA ($3.06) and the 23.6% Fibonacci retracement ($3.07). The MACD histogram flipped positive (+0.0223), while the RSI (57.09) suggests room to extend without tipping into overbought conditions. Immediate resistance sits at $3.18, with a clean break opening the door to the $3.48 target at the 127.2% Fibonacci extension. XRP’s latest move combines ETF-driven institutional interest, technical resilience, and altcoin market tailwinds. While the ETF structure may not drive direct XRP demand as aggressively as a spot product, its novelty could attract new pools of capital and further legitimize the asset in U.S. markets. Source: https://finbold.com/5-billion-floods-into-xrp-in-a-day-heres-why/
Share
BitcoinEthereumNews2025/09/18 19:32

Trade GOLD, Share 1,000,000 USDT

Trade GOLD, Share 1,000,000 USDTTrade GOLD, Share 1,000,000 USDT

0 fees, up to 1,000x leverage, deep liquidity